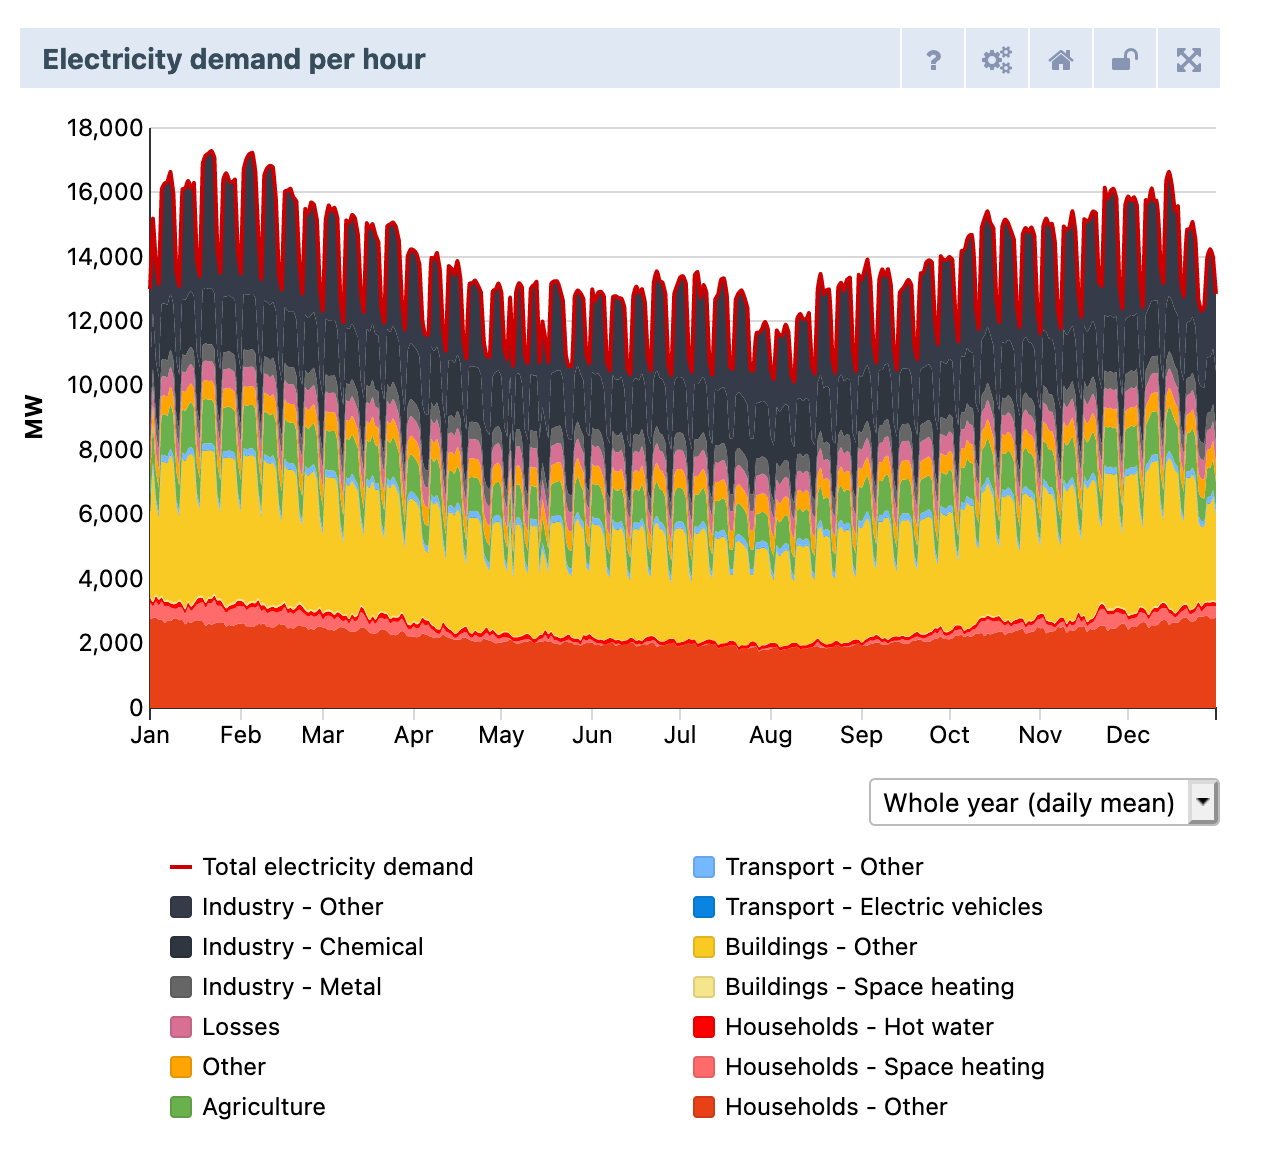
Dynamic electricity demand curve
The behaviour of heat pumps and electric vehicles is modelled explicitly and on an hourly scale. The chart 'Electricity demand per hour' gives an overview of the demand and in the Flexibility > Modify profiles section of the ETM you can view the specific demand of heat pumps and electric vehicles. This page explains which profiles were used to model the behaviour of these technologies.
Checkout: the 'Curves' infopage for more information.
Scope of implementation
Included technologies
- Electric vehicles
- Space heating
- Hot water
- Other
Profiles used
Electric vehicles
The ETM uses five different profiles to determine the demand of EV’s based on research performed by Movares (Movares, 2013) and Elaad. These five profiles are:
- Charging at home
- Charging everywhere
- Fast charging
- Charging smart (Elaad)
- Charging regular (Elaad)
You can use these profiles to adjust the charging behaviour of electric cars. In all profiles weekend days are considered differently from weekdays. You can find these profiles in the Flexibility section under ‘Net load’> ‘Demand response – electric vehicles’.
Hot water
The hot water profiles are based in great part on "Realistic Domestic Hot-Water Profiles in Different Time Scales" (Jordan, 2010). This study assumes a daily average DHW use of 200 liters and distinguishes different types of DHW consumption, each with an associated volume and average daily occurrence. The ETM-profile is based on this average volume and daily occurrence.
The hot water profile simulates the average hot water demand. Because this aggregated profile is used the load on the network is modelled well. However, the disadvantage is that the behaviour of hot water technologies is not modelled perfectly with an aggregated profile as the peaks of the demand are higher on an individual level.
Space heating
The shape of the demand profile for space heating depends on house type and insulation level. For example a poorly insulated detached house will have a more spikey profile than a well insulated apartment. The ETM takes this into account by basing the average profile on the type and insulation level of the current housing stock. The shape of the demand curve changes when the insulation levels are changed by the user.
The space heating profiles used by ETM are based on profiles made by ECN and used by Ecofys in their study "Systeemkosten van warmte voor woningen" (Ecofys, 2015). ECN devised different profiles for 5 types of houses and 3 insulation levels for each type.
House types:
- Row house
- Corner house
- Semidetached house
- Apartment
- Detached house
Insulation levels:
- Low
- Medium
- High
Dutch housing stock (ABF Research, 2014)
- Row house: 31%
- Corner house: 12%
- Apartment: 30%
- Semidetached house: 12%
- Detached house: 15%
Source: ABF Research, 2014: Ontwikkelingen op de woningmarkt – Socrates 2013
For old houses the minimum slider settings gives the weighed average profile corresponding to low insulation. For new houses, which are currently more insulated than old houses, the minimum slider settings gives the weighed average profile corresponding to medium insulation. For both old and new houses the maximum slider setting gives the weighed average profile corresponding to high insulation. A slider setting which is between the minimum and the maximum insulation value gives a weighed mix of the profile corresponding to the minimum and the maximum value.
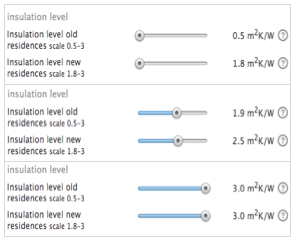
Note: In the ETM the insulation level can be set with sliders. The minimum slider setting corresponds to the current insulation level. The maximum slider setting corresponds to theoretically maximum insulation.
The temperature curves that are used to make the space heating demand curves are based on KNMI measurements in The Bilt (KNMI, 2017).
The default temperature curve and corresponding profiles is the same as the base year. In 1987, the Netherlands experienced an exceptional cold snap in the second week of January, which significantly increased the demand for space heating. This may happen again in the future, and low temperatures may negatively affect the ability for air and hybrid heat pumps to satisfy demand. In the ETM “cold snap” can be selected to use the 1987 heat demand and air temperature.
Sources: other sources used are Ecofys, 2015 (Systeemkosten van warmte voor woningen) and Jordan, 2010 (Realistic Domestic Hot-Water Profiles in Different Time Scales)