Insulation
Insulation can be used to bring down the amount of heating we need for our houses while staying comfortable. The ETM allows you to choose insulation levels for each housing type and for all buildings (in the Commercial and Public Services, shortly CaPS, sector) separately in the Demand > 'Household' or 'Buildings' section. This page discusses the modeling methods used for the implementation of insulation in the ETM and the data that underlies the modeling.
Housing types
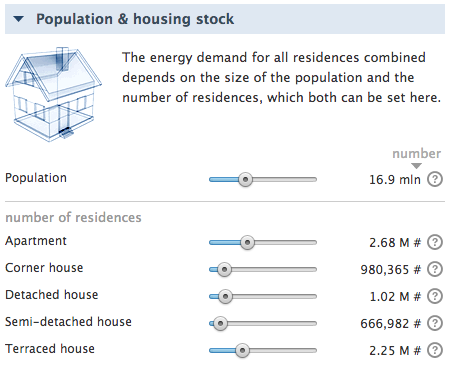
The ETM distinghuishes five housing types for modelling heat demand in households: apartments, corner houses, detached houses, semi-detached houses and terraced houses. These housing types are recognisable in the Netherlands and used in the Basisregistratie Adressen en Gebouwen (BAG), which contains all official data of all households and buildings in the Netherlands.
Heat demand reduction
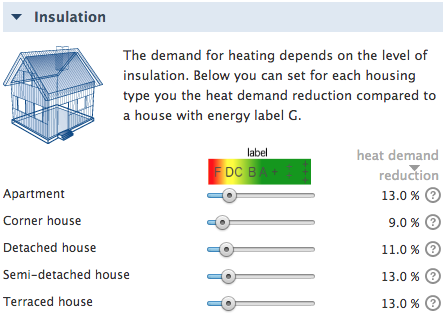
There is one insulation sliders for each housing type. The insulation sliders set the heat demand reduction, which is the fraction of heat demand that is saved through insulation. The heat demand reduction is derived from the "Energie-Index" (EI, energy performance index) of the houses and buildings within a region, which is retrieved from BAG-data for the Netherlands. The EI represents the energy performance of the house/buildings: how energy-efficient is it? Unfortunately, the mapping between heat demand reduction and the EI is ambiguous, because the EI does not only depend on the insulation level. Instead it is based on 150 different factors (source: RVO), including the presence of solar panels or the type of heating technology installed, which both do not influence the heat demand of a building. Additionally, the EI is not definitive for many houses yet. Energy labels are the simplified version of the EI.
Despite the above reasoning, the EI is used in the ETM because there is no other data available. It still gives a reasonable insight into the average insulation level of a region. This is the mapping that was used to translate the EI into a heat demand reduction for each housing type relative to the lowest possible energy label G:
| Energy label | Energie-Index | Detached | Corner | Terraced | Semi-detached | Apartement |
|---|---|---|---|---|---|---|
| G | > 2.7 | 0% | 0% | 0% | 0% | 0% |
| F | 2.41 - 2.7 | 4% | 3% | 3% | 4% | 3% |
| E | 2.11 - 2.40 | 7% | 5% | 5% | 9% | 5% |
| D | 1.81 - 2.1 | 11% | 13% | 13% | 13% | 8% |
| C | 1.41 - 1.8 | 17% | 21% | 21% | 18% | 17% |
| B | 1.21 - 1.4 | 24% | 29% | 29% | 29% | 27% |
| A | 0.81 - 1.2 | 37% | 35% | 37% | 40% | 32% |
| A+ | 0.61 - 0.8 | 50% | 42% | 46% | 50% | 38% |
| A++ | 0.41 - 0.6 | 59% | 55% | 57% | 60% | 52% |
| A+++ | < 0.4 | 67% | 69% | 69% | 69% | 67% |
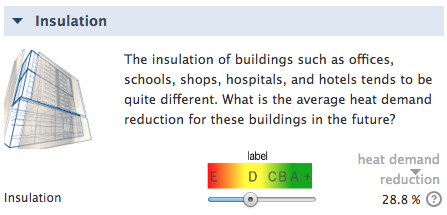
For utility buildings the heat demand reduction is calculated relative to a label E building, because there is no sufficient data available for lower energy levels:
| Energy label | Energie-Index | Buildings |
|---|---|---|
| E | 2.11 - 2.40 | 0% |
| D | 1.81 - 2.1 | 31% |
| C | 1.41 - 1.8 | 46% |
| B | 1.21 - 1.4 | 54% |
| A | 0.81 - 1.2 | 64% |
| A+ | 0.61 - 0.8 | 74% |
The above tables show a rough estimate of the relationship between energy labels, EI and heat demand reduction. The mapping is based on the following data:
- The heat demand per energy label is based on data of the energy model Vesta developed by PBL Netherlands Environmental Assessment Agency (link to website). For labels that are not specified in the data, the heat demand is interpolated. These are the links to the datasets:
- The maximum heat demand reduction for a label A+++ house is retrieved from the Ecofys report 'De systeemkosten van warmte voor woningen (2015)'.
Note: the label image above the household insulation sliders shows the average label vs. heat demand reduction mapping for all housing types.
Insulation costs
In the ETM costs are calculated based on the 'greenfield approach', which means that no costs are calculated for the current situation and costs are only added when changes occur. So insulation costs are only taken into account when the insulation in houses is increased. (NOTE: when the user reduces insulation, nothing happens: neither to the costs or to the heat demand. Reducing insulation is not considered as realistic)
Households
The insulation costs for houses are based on the Ecofys report 'De systeemkosten van warmte voor woningen (2015)', where the investment costs for different 'insulation jumps' (low -> medium insulation, low -> high insulation, medium -> high insulation) are specified (using insulation costs from 2020). The table below shows the insulation costs for existing houses.

When the number of houses increases for a certain housing type, the newly built insulation costs are taken into account for these newly built houses. If the insulation level of that housing type is not set on "high" insulation, interpolated insulation costs are used. The insulation costs in the table below only include the materials used (so cost of labor are not included).

Low, medium and high insulation in the report is roughly specified as:

To link the insulation costs to specific heat demand reductions,ECN heat demand profiles were used that have been used for the Ecofys study. These heat demand profiles are available for each housing type and the three insulation levels. First, the total heat demand per year is summed for each insulation level and each housing type. Then the heat demand reduction is calculated for each housing type relative to the heat demand of the low insulated house. The calculation resulted in the following mapping between low/medium/high insulation and heat demand reduction:
| Housing type | Low | Medium | High |
|---|---|---|---|
| Apartment | 0% | 32% | 67% |
| Corner house | 0% | 23% | 69% |
| Detached house | 0% | 23% | 67% |
| Semi-detached house | 0% | 26% | 69% |
| Terraced house | 0% | 31% | 69% |
The insulation sliders are continuous and not limited to only three choices (low / medium / high). Therefore, the insulation costs have been interpolated; the resulting .csv-files can be found here.
Note: The insulation costs for houses are not a fixed amount per % heat demand reduction, but instead the costs depend on the level of insulation in the present year: e.g. going from 0 to 30% is cheaper than going from 30% to 60% insulation.
Buildings
The insulation costs for buildings could not be retrieved from the Ecofys study. Instead, the costs originate from the BAG-data used in the Vesta energy model (Vesta Utiliteiten BAG (2016) & Vesta Utiliteiten Nieuwbouw BAG (2016)):
- In these datasets the insulations costs are given for each insulation jump and each type of utility building. Since the ETM only models an average utility building, a weighted average has been calculated for the insulation costs. This was done based on the Dutch distribution of floor area between the different utility building types (ECN).
- The datasets report minimum and maximum insulation costs, based on taking the insulation measures on a natural vs. independent moment, respectively. A natural moment would be when several buildings are renovated at once, so insulation would cost less money than when one building is separately insulated on an independent moment. For new buildings it is assumed that the insulation costs to be the minimum and for existing buildings the average of the minimum and maximum costs are taken.
The above assumptions result in the following insulation costs for an average utility building:
| Type | Insulation costs [€ / % heat demand reduction] |
|---|---|
| Existing utility building | € 605.99 |
| New utility buidling | € 478.55 |
Heat demand profiles
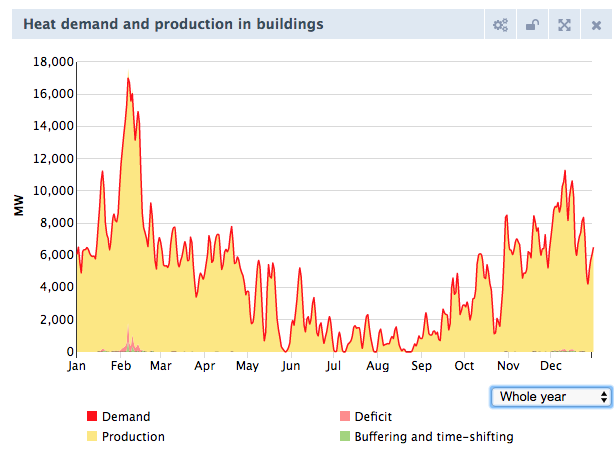
The ETM models heating in households and buildings on an hourly basis in the so-called "Fever" calculation. For this calculation hourly heat demand profiles for houses and buildings are needed.
Households
The housing type and insulation level both have influence on the heat demand profile of a house. High insulated apartments for example have a flatter profile than low insulated detached houses. As heating technologies per housing type in the ETM cannot be specified, one average hourly heat demand profile is constructed for the housing stock in general and used in the Fever calculation.
The households heat demand profiles originated from the ECN heat demand profiles from 1987, which was a year with a very cold winter (link to profiles). These profiles are available for each of the five housing types and low / medium / high insulation. These profiles were modified to fit 2015 with this script, since the 2015 heat demand profiles are not publicly available.
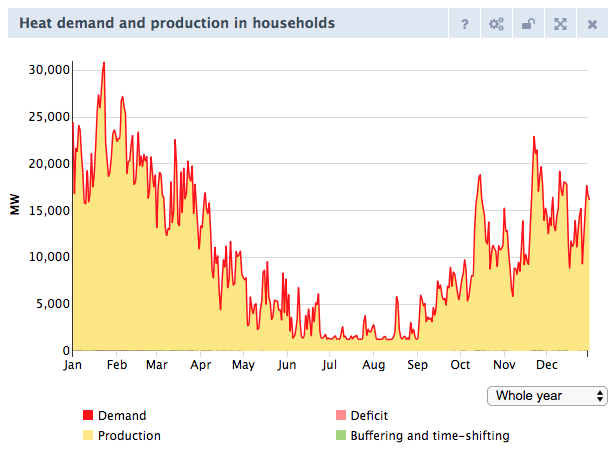
The insulation sliders influence the heat demand profile of that specific housing type; it is interpolated between the low, medium and high insulation heat demand profile. The average heat demand profile for the housing stock in general is than constructed based on the shares of the different housing types. This results in the following heat demand profile (including hot water demand) for the Netherlands when there would be 50% low insulated detached houses and 50% high insulated terraced houses:
Buildings
For buildings the heat demand profile was harder to construct, since no public heat demand profiles are available. This is the profile that is used for the time-resolved calculation (link):