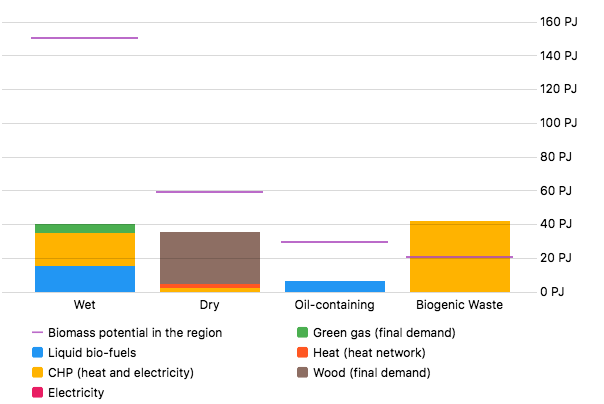
Category bar chart
The category bar chart shows query values in a stacked columns, split into different categories. Positive values are stacked above zero, while negative values are stacked below.
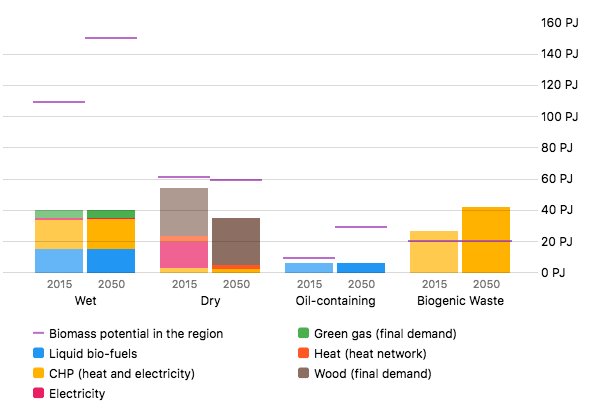
Chart options
Create a category bar chart by setting the output_element_type_name to "category_bar".
config.period
The only option unique to the category bar chart is config.period whose value may be:
- (blank) – When no
periodis specified, both present and future values are drawn on the chart. You may omit theconfigattribute entirely when this is the case. - present – Only values for the present are shown.
- future – Only values for the future are shown.
For example:
- key: biomass_demand_by_category
  config:
    period: future
  group: Supply
  output_element_type_name: category_bar
  sub_group: biomass
  unit: PJ
When only the future or present are shown in a chart, the year is omitted from the horizontal axis.
unit
Sets the default unit used for values on the vertical axis. This may be scaled – for example from PJ to GJ – depending on the data.
Series options
Values on the chart are drawn according to the series specified in an output_element_series config file.
- key: bio_fuels_wet_biomass_demand_by_category
  gquery: bio_fuels_from_wet_biomass
  color: "#2296F3"
  is_target_line: false
  group: wet
  label: bio_fuels
  order_by: 1
  output_element_key: biomass_demand_by_category
key
A unique key which identifies the series. The need to specify a key may be removed at a later date.
gquery
The key of the gquery which provides data for the series.
color
A hexadecimal colour used as the color for the series.
is_target_line
This value may be set to true to draw the query value as a horizontal line, rather than stacked as part of the chart. This is useful for showing capacities or other limits, rather than demands.
When this attribute is omitted it is treated as false, with the query being drawn as part of a stacked bar.
group
A name identifying to which group (category) the series belongs. The group may be any value you wish, and does not have to be declared anywhere. All series which have the same group will be drawn as part of the same stacked bar. The biomass chart example has series belonging to four groups: "wet", "dry", "oily", and "biogenic_waste".
The value of the group will be translated using the output_element_series.groups namespace:
label
Used as the human-readable name for the series in the legend and tooltips. The value of the label will be translated using the output_element_series.labels namespace:
order_by
Determines the order in which the series are drawn on the chart. Lower values are drawn first and thus appear earlier closer to zero on the vertical axis.
When creating a new chart, it is good practice to use order_by values that aren't too close. This makes it easier to add new series to the middle of the chart, without having to assign new order_by values.
For example, the first category may use values 100, 105, 110, 115; the second category uses 200, 205, 210; while the third uses 300, 305, 310, etc.
output_element_key
The key of the chart to which the series belongs.
Universal series attributes
Some series attributes work across multiple chart types. These include:
hide_label
When set to true, the series will not appear in the chart legend. This is useful when you have duplicate series representing the same category but for different time periods (e.g., present/future values and 1990 baseline values), preventing cluttered legends with redundant entries.
This attribute is optional and defaults to false when omitted.
This attribute works with all chart types that use legends, including category bar, vertical stacked bar, bezier, and line charts.