Biomass
There is a growing interest in using biomass as energy carrier, for instance for: heat production, electricity production, transport fuel or as a feedstock for the chemical industry. However, biomass is often grown at the expense of food crops and stimulates deforestation. Careful consideration is required when using large amounts of biomass. In the Supply > Biomass section in the ETM you can specify biomass use. This page describes the biomass definitions used in the ETM, the application of biomass within the ETM as well as the biomass data that is used within the ETM.
Checkout: how CO2 emissions from biomass are regarded within the ETM on the Carbon Emissions from Biomass infopage.
Biomass categories
There are many different biomass resource streams; too many to model each one individually. Therefore, the ETM distinguishes four biomass categories:
- Wet biomass: residues from the food and beverage industry, agricultural residual streams, sewage sludge, aquatic biomass, cultivated grain products, etc.
- Dry biomass: residual streams from forestry (tree tops, stumps, bark, branches), recycled waste wood, residual streams from agriculture (straw), and fast-growing bio-energy crops (elephant grass, willow, poplar)
- Oil-containing biomass: rapeseed, sunflower seeds, oil palm, used frying fats.
- Biogenic waste
Biomass potential
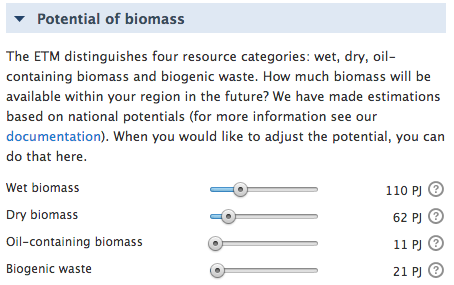
TNO researched the potential of each biomass category for each country modelled in the ETM. When biomass demand exceeds this potential, biomass is imported from outside the region. For the Netherlands TNO researched the potentials in great detail. The potentials of over 30 biomass streams have been quantified and are shown in the last table of this document. The ETM allows users to adjust maximum biomass potentials for each biomass category with these sliders:

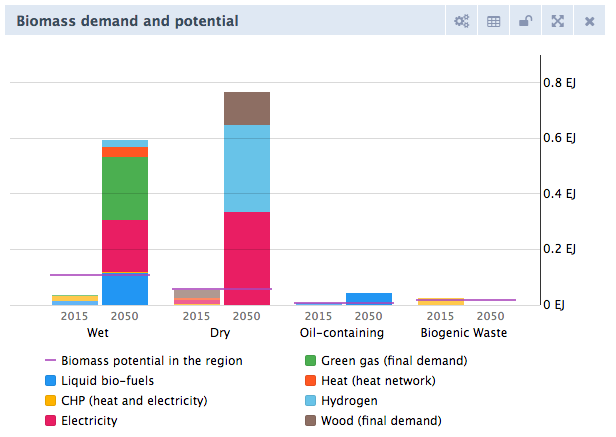
The set potentials are shown in the "Biomass demand and potential" chart along with the total demand of each biomass category. This gives the user a feeling of how much biomass is still regionally available.

Using biomass in the ETM
Biomass can be used in different places throughout the model, such as:
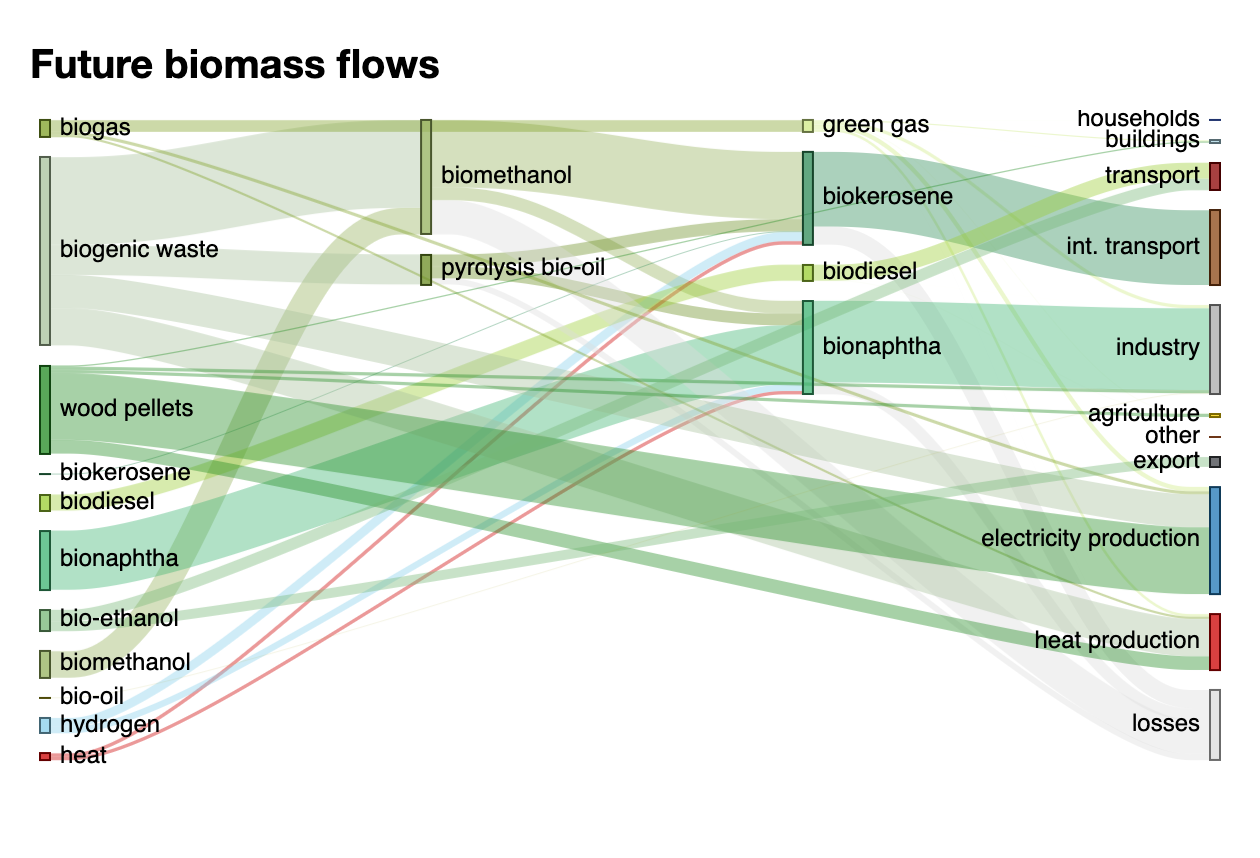
- green gas in the gas network
- in biomass power plants, CHPs and heaters for electricity production and heat production for (local) heat networks
- as transport fuel, for example bio-ethanol, biodiesel, bio-LNG and biokerosene
- as feedstock in chemical industry, for example bionaphtha and biomethanol
- to produce hydrogen through gasification
To get a quick overview of all future biomass flows and conversions, a flow diagram is available visualising these:

Biomass costs
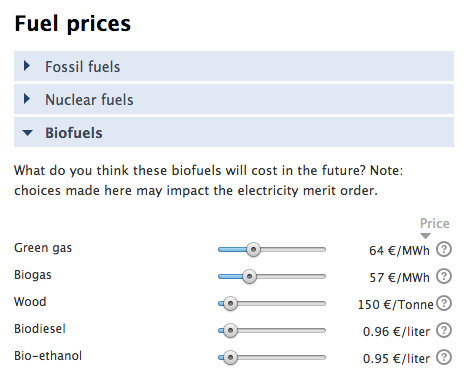
You can adjust the costs of biofuels with sliders for greengas, biogas, wood, biodiesel and bio-ethanol. The costs for biomass are researched by TNO.

Input data
Green gas production costs
TNO has researched the production cost for greengas producing technologies:
| Unit | Wet gasification (SCW) | Dry gasification | Anaerobic digestion | |
|---|---|---|---|---|
| Efficiency | % | 70 | 70 | 48 |
| Production costs | EUR/MWh | 41.33 | 75.79 | 63.57 |
| Input capacity | MW input | 20 | 70 | 8.33 |
| Investment costs | EUR | 19 | 130 | 4.7 |
| Fixed yearly O&M costs | EUR/jaar | 3 | 9.5 | 0.23 |
Caution: the production costs of green gas are not optimized; this is mainly the case for the gasification technologies. Since these technologies are fairly new, there are not many practical examples on which the costs are based.
Dutch biomass potential
TNO has researched the potential biomass production in the Netherlands for 2030:
| Unit | Wet biomass | Dry biomass | Oil-containing biomass | Biogenic waste | |
|---|---|---|---|---|---|
| Dutch biomass potential 2030 | PJ | 109.9 | 62.2 | 10.5 | 21.4 |
These total potentials originate from the underlying biomassa streams depicted below (available in Dutch only):
| Sector | Biomassastroom | Categorie | Potentie PJ (droge stof basis) | Verdeelsleutel van nationale naar gemeentelijke potentie |
|---|---|---|---|---|
| Voedings- en genotmiddelenindustrie | Frituur en restvettten | vet | 10.5 | Bevolking |
| Natte stromen VGI | nat | 6.5 | Cultuurgrond - Blijvend grasland | |
| RWZI/AWZI-slib | Slib RWZI | nat | 3.52 | Bevolking |
| Slib AWZI | nat | 1.353 | Cultuurgrond - Blijvend grasland | |
| Slib verbrand | afval | 3.39526 | Bevolking | |
| Agrarische reststromen | Drijfmest | nat | 25 | Melkkoeien + Varkens |
| Droge mest | droog | 8.8 | Melkkoeien + Kippen | |
| Stro | droog | 2.6 | Granen (are) | |
| natte gewasresten | nat | 11 | Akkerbouwgroenten | |
| Groente-, Fruit- en Tuinafval & Organische natte Fractie (GFT en ONF) | GFT | nat | 8.7 | Bevolking |
| ONF in afval (nat) | nat | 1.8 | Bevolking | |
| ONF in afval (afval) | afval | 3.6864 | Bevolking | |
| Zeefoverloop | droog | 0.728 | Bevolking | |
| Droge biomassa | Resthout uit houtverwerkende industrie | droog | 5.32 | Bevolking |
| afvalhout | droog | 19.76 | Bevolking | |
| afvalhout particulier | droog | 2 | Bevolking | |
| Papierresiduen | afval | 2.3 | Bevolking | |
| Papier in afval | afval | 12 | Bevolking | |
| Nederlandse productiebossen | Productiebos | droog | 3.2 | Bos (ha) |
| Productiebos particulier | droog | 4 | Bevolking | |
| Korte omloop bomen | droog | 0.000855 | Totaal agrarisch terrein | |
| Korte omloop bomen (bijschatting TNO) | droog | 0.38 | Totaal agrarisch terrein | |
| Import/onbekend particulier | droog | 2 | Bevolking | |
| Natuur en landschapsbeheer | Hout van fruit- en boomteelt | droog | 0.396 | Totaal agrarisch terrein |
| Hout uit landschap | droog | 4.752 | Totaal gemeentelijke en waterschapswegen (km) + Park en plantsoen (ha) | |
| Tuin/landbouw/openbaar groen | droog | 7 | Bevolking | |
| natuurgras+bermgras | nat | 5 | Totaal gemeentelijke en waterschapswegen (km) + Bos (ha) | |
| Heide | droog | 0.023375 | Open droog natuurlijk terrein | |
| Aquatische biomassa | Riet en andere waterplanten | nat | 18 | Open nat natuurlijk terrein + Recreatief binnenwater + Overig binnenwater |
| Microalgen | nat | 1.5 | Totaal agrarisch terrein | |
| Zeewier | nat | 12 | Bevolking | |
| Energieteelt | Totale natte energieteelt | nat | 3.5 | Totaal agrarisch terrein |
| Totale droge energieteelt | droog | 1.2 | Totaal agrarisch terrein | |
| Grassoorten op zoute grond | nat | 12 | Noord Beveland 10% Veere 20% Vlissingen 10% Middelburg 10% Texel 10% Het Hogeland 40% |
The Dutch national potentials were subdivided to municipal potentials by using the 'verdeelsleutel' for each individual biomass stream from the most right column in the table above.
Source: The TNO report with all data is accessible here.
Collaboration: The biomass section within the ETM is shaped in close collaboration with Gasunie, GasTerra, TKI Nieuw Gas and TNO. TNO researched and delivered all required data.