Interface
This page explains the main features displayed in the interface of the ETM. You will land in the ETM interface after starting or opening a scenario. Here you will find the following topics:
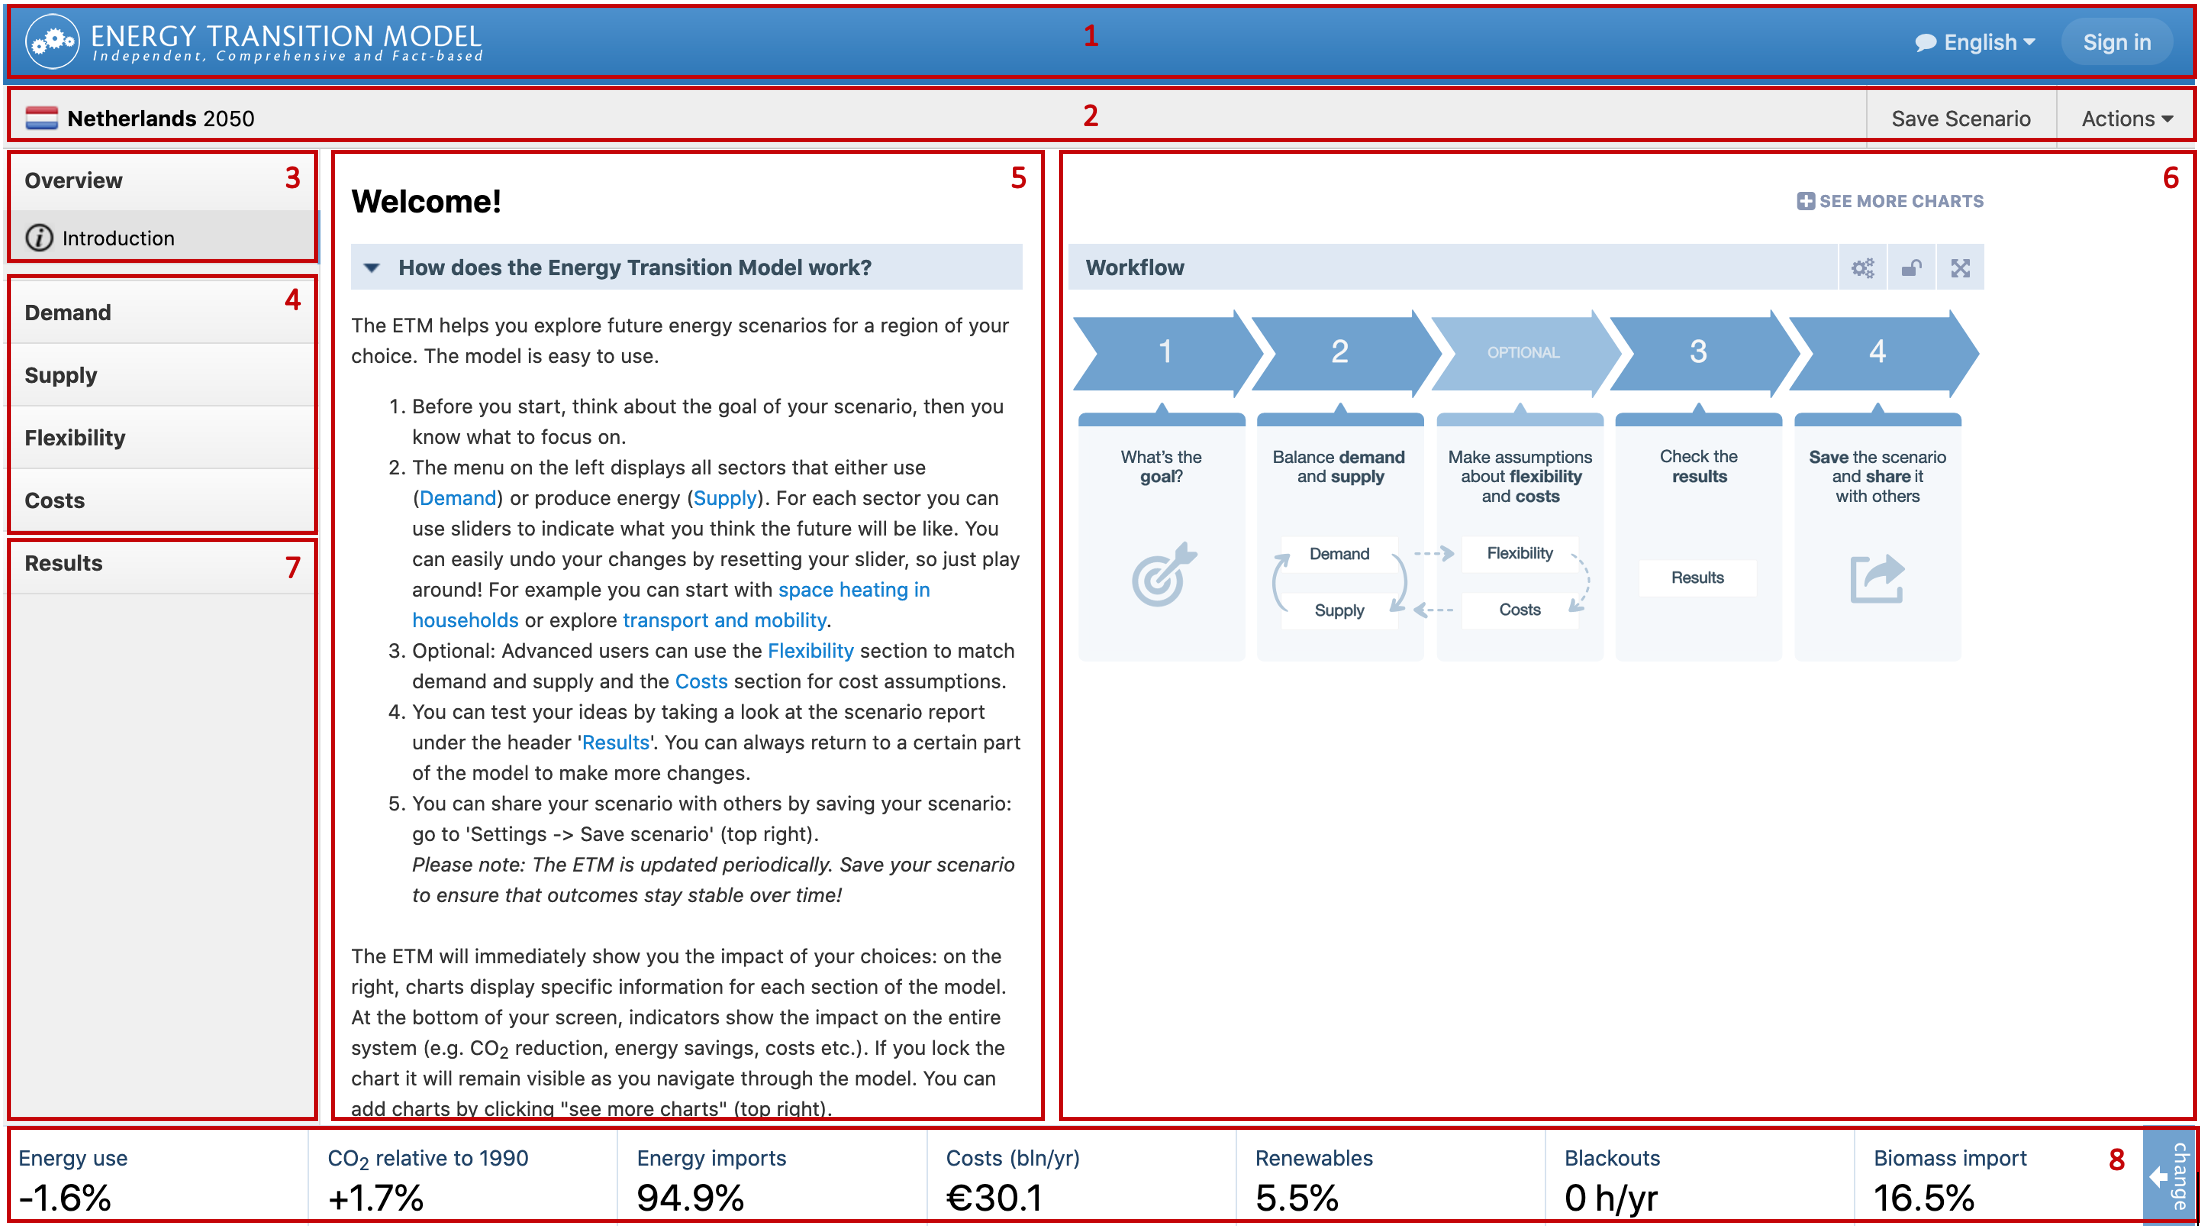
1. Head banner
Here you can go back to the scenario landing page by clicking on the logo, choose your language (English or Dutch) or sign in if you have an ETM account. Using your account you can save scenario’s or open previously saved scenario’s. If do not have an account but want to create one, simply click on the ‘sign in’ button and choose ‘sign up’.
2. Scenario toolbar
In the ‘scenario toolbar’ your current scenario name and end year is visible. To the right you can save the scenario by clicking ‘save scenario’. This option is only available when you have an account and are logged in. Under ‘Actions’ you have the option to save the scenario with a new name by clicking ‘save scenario as…’ or reset the entire scenario by clicking ‘reset scenario’.
3. Introduction
A short introduction to the ETM will guide you in creating your (first) scenario.
4. Toolbar
The toolbar allows you to influence the main elements of the future energy system in your region: Demand: what happens to energy consumption in the future? Supply: which technologies will be used to produce heat, electricity and fuel in the future? Flexibility: future energy systems will most likely be characterized by times of excess electricity due to the volatile nature of the electricity production. Flexibility technologies, like battery storage and power to gas allow you to deal with this excess electricity. Costs: specify what you think will happen to the costs of carriers and technologies.
Checkout: the Detailed Explanations section for more information on calculations and definitions.
5. Tools and sliders
In the ETM you can use sliders to manipulate the current situation to produce a future energy scenario. You can either:
- drag the slider
- use the + and – when more precision is needed
- or type directly into the slider by clicking on the number. The reset button will reset this slider to the current amount. When you need more information about a particular slider the help (?) button will explain the details.
When you do not touch a single slider the future will be regarded as identical to the starting year situation. If you do change a slider this will have a direct effect on the energy flow which is calculated within the model and therefore have an effect on the energy system as a whole.
6. Graphics
Different types of charts and graphics give direct feedback on the effect of your scenario choices. The help (?) button can provide more information about the specific graph. The change chart button (..) lets you pick and view a different chart from the list. The table button (..) converts the chart to a table. The lock button (..) locks the chart while you can continue working on your scenario in different topics or energy system components. With the widen button (..) you can enlarge the graph to spot the details. The ‘+ see more charts’ button at the top allows you to see multiple graphs at the same time.
7. Results
In the results tab you can find different overviews portraying the outcomes based on your scenario. The ‘visuals’ tab contains a number of different formats all portraying different aspects of your energy scenario. The ‘scenario report’ is the most comprehensive containing a textual and graphic explanation of your scenario. Other sub-tabs (‘Energy Mix Inforgraphic’, ‘CO2 footprint’, ‘Graph and energy flows’ and ‘CCUS’) each portray a different visual explanation of your scenario. The ‘data export’ tab under the ‘visuals’ tab lets you export data generated in the ETM (CSV) which can serve as input for your own graphs or other models.
8. Dashboard
The dashboard shows direct feedback on the most important outcomes of your scenario. The change button to the right makes it possible to show a different numerical output on the dashboard. The numbers shown in the dashboard and ETM as a whole always reflect the difference between the start- and end year you have chosen for your scenario except for the item that show the difference in CO2 emissions from 1990.
Checkout: the Dashboard section in this documentation for more information.