Electricity storage forecasting
Introduction
In the Energy Transition Model, electricity storage technologies will charge and discharge whenever it is cost-effective for them to do so. These technologies are governed by a willingness to pay – the price they are willing to pay to store electricity – and a willingness to accept – the price they are willing to accept for discharging stored energy. This price-based behaviour is described in detail in the electricity storage documentation.
While this ensures that electricity storage technologies will not charge and discharge in such a way as would result in a loss, fixed prices can be inflexible and unrealistic. For example, setting a price suitable for winter months when prices tend to be higher, may result in behavior which is less suitable for the summer months.
Electricity storage technologies have an optional forecasting option. When enabled, the technology is no longer controlled by the market price of electricity, but will instead forecast the electricity load for the year and decide when to charge and discharge accordingly. For household batteries there is a third option for which the battery forecasting algorithm is only applied to the household sector.
In this mode, the goal of a storage technology is to flatten the residual load curve as much as possible. This also generally increases the profitability of the technology.
The residual load curve is the sum of demand in each hour, minus the sum of supply from must-run and volatile producers. This results in a curve describing the "residual load" for each hour in the year.
Whenever the value for an hour is positive, electricity demand is not fully satisfied by must-run and volatile producers, with dispatchable/flexible sources needed to meet demand. If the value is negative, this indicates a surplus of energy.
See Costs → Merit Order → Implementation for more details.
Algorithm
The forecasting algorithm matches an hour of high residual load with an hour of low or negative load from the preceding 72-hours. It causes the electricity storage technology to charge when load is low and discharge the same amount when load is high. This has the effect of flattening the residual load curve, reducing peaks in favor of a more constant curve.
The algorithm accounts for the input and output capacity, the total volume, and the efficiency of the storage technology.
Example
Selecting charge and discharge hours
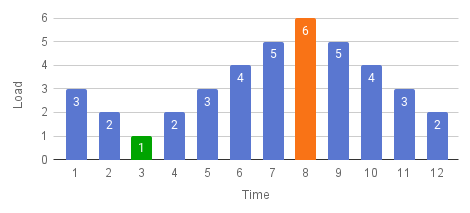
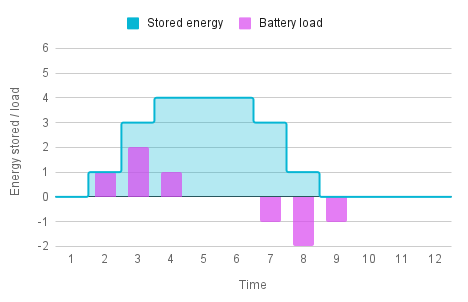
Here we have a curve which varies gradually from a minimum value of 1 up to a maximum of 6. The algorithm selects hour 8 (orange) as the hour of highest load, and finds the hour of lowest load (green).
Placing a charge
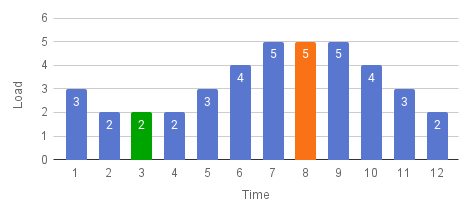
The storage technology is told to charge in hour 3 and discharge in hour 8. This has the effect of flattening the residual load curve slightly. As residual load is often highly correlated to the market price for electricity, it's likely that the technology operator will make a profit from this cycle.
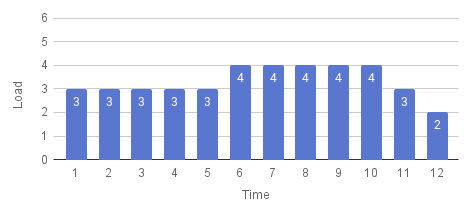
Iterating
The algorithm continues selecting high and low hours until the storage technology is at full capacity in each hour or, more often, there are no opportunities to flatten the curve further without a high likelihood of incurring losses.
Merit Order
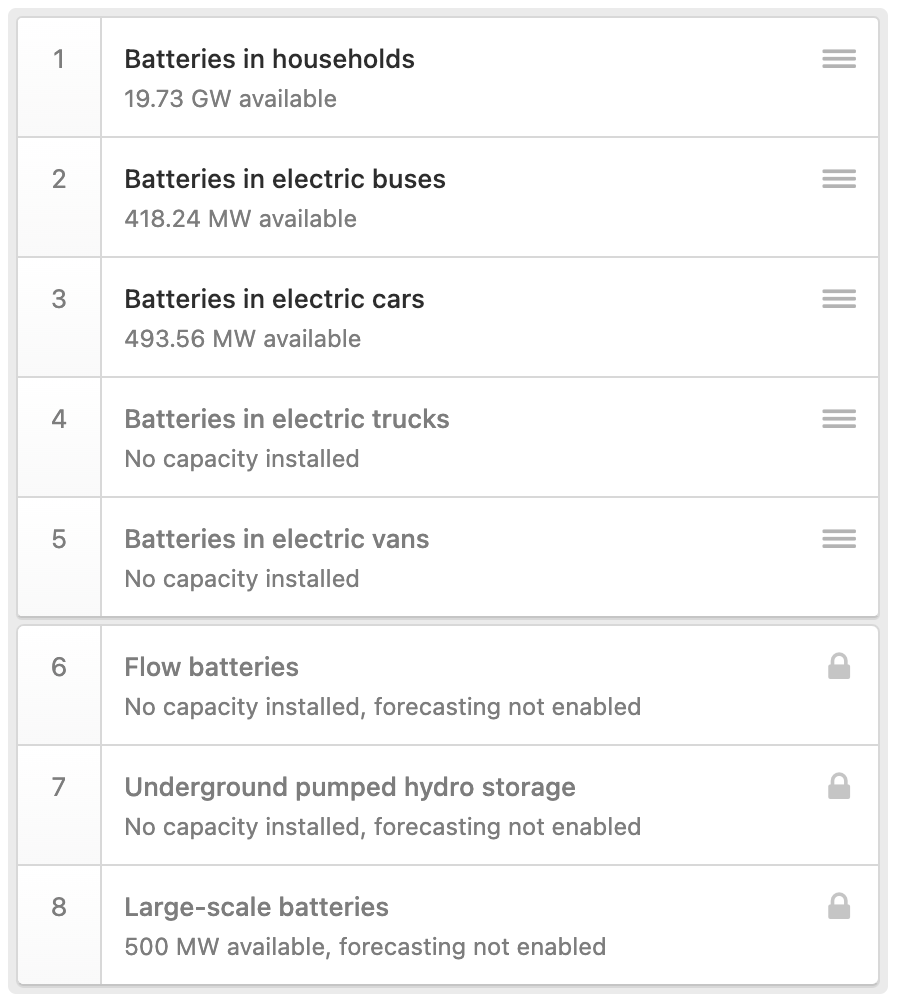
If the forecasting algorithm is enabled for multiple storage technologies, a merit order is used to determine in which sequence technologies are applied to flatten the residual load. This merit order can be set by the user Flexibility → Merit order.
The first technology in the merit order will try to flatten the original residual load curve. The next technology will be applied to the flattened residual load curve that is produced by the first technology. It will try to flatten that curve even further. This continues until each technology for which the forecasting algorithm is enabled has been utilized.
Technologies for which the forecasting algorithm is disabled are shown in the list, but do not participate in the merit order. They are therefore marked grey and locked in place until the forecasting algorithm is enabled. Technologies for which no capacity is installed are marked grey as well.
FAQ
Why is the charge/discharge cycle limited to a 72-hours?
After selecting an hour of high load, the algorithm looks for an opportunity to charge in the 72-hour period before the high load. This limit serves several purposes:
- In some kinds of electricity storage technologies, storing energy for too long is likely to incur losses; energy in batteries slowly decays, water stored in reservoirs evaporates.
- While holding energy in storage for long periods of time may be realistic for some storage technologies (pumped hydro), it is not realistic for smaller-scale battery technologies such as household batteries.
- Longer cycles increase calculation time and would result in your scenario becoming sluggish when you make changes.
During experimentation with the algorithm, it was found that periods longer than 72-hours quickly resulted in diminishing returns. Profits from storage technologies did not increase significantly, while calculation time increased unacceptably.
Note that this does not mean that the battery must fully charge and discharge every 72-hours. Rather, any amount of energy charged in one hour – which may be a fraction of the battery capacity or volume – must be discharged within 3 days.
What are the specifications for batteries in the ETM?
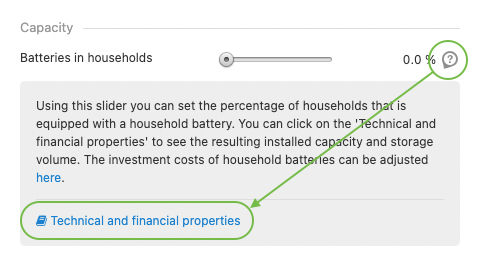
To view the specifications for an electricity storage technology, click the (?) icon next to the slider, then "Technical and financial properties". This will show you a screen summarizing the total installed capacity and volume, efficiency, and costs of the technology.
References
- Practical operation strategies for pumped hydroelectric energy storage (PHES) utilising electricity price arbitrage. Energy Policy, 39(7), 4189–4196.