Outdoor temperature
The ETM allows you to explore the impact of changes in outdoor temperature on energy demand using the temperature slider in the weather conditions section. Outdoor temperature impacts heating and cooling demand in households, buildings and agriculture. A lower average temperature leads to a higher heating demand and a lower cooling demand in those sectors. Conversely, a higher average temperature decreases heating demand and increases cooling demand. This page explains how the changes in outdoor temperature effect your scenario.
Impact on heating demand
The ETM assumes that space heating demand in households, buildings and agriculture is temperature-dependent, as well as cooling demand in households and buildings (see below). Other energy applications, such as hot water, appliances, transportation and industrial processes are assumed to be temperature independent.
The temperature dependent demand is assumed to increase by approximately 15.1% per degree C below the average. This relationship is assumed to be linear and works both ways: a 1 degree C increase leads to a 15.1% lower demand.
Formally:
heat_factor = 1.0 - 0.1507409694x
(where x is the change in temperature in degrees C)
This heat factor is applied to all temperature-dependent useful demand nodes in the ETM.
Below, the sources and assumptions behind these numbers are explained in detail.
Degree days
The impact of the average outdoor temperature on heating demand is based on research by the Task Force Monitoring L-Gas Market Conversion and the Dutch gas TSO Gasunie Transport Services. The latter regularly publish a so-called 'degree days equation' that links degree days to gas demand.
A degree day is defined (in this context) as a fall of one degree below an average effective outdoor temperature of 14°C. For example, if the average effective outdoor temperature is 8°C on a certain day, this day counts as 6 degree days. On average, the number of degree days per year is 2300 in the Netherlands.
The average effective temperature is defined as the daily average outdoor temperature (in °C) minus two-thirds of the daily average outdoor wind speed (in m/s).
For the 'gas year' 2019/2020 the estimated relationship between degree days and gas demand is as follows:
Gas demand [bcm] = 26.163 + 0.0105 * number of degree days (source, p.6)
This means that 26.163 bcm (billion cubic metres of natural gas) is temperature independent. For each degree day, total gas demand goes up by 0.0105 bcm.
Note: Please note that this equation is about the demand for low-caloric gas (L-gas) in The Netherlands, as well as parts of Belgium, France and Germany.
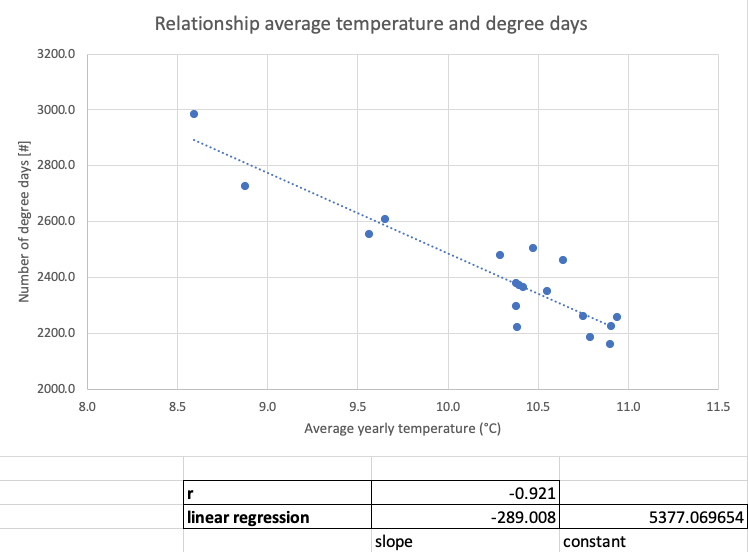
Degree days and average temperature
Based on historic weather data for The Netherlands, it is estimated that there is a (roughly) linear relationship between the number of degree days in a year and the average yearly temperature. A 1°C increase in temperature decreases the number of degree days by 289 (source).
Temperature dependent demand
For the year 2019/2020, research by the IEA, ENTSOG and the Dutch Ministry of Economic Affairs shows that Dutch L-gas demand is expected to increase by 15.9% in a 'cold year' compared to a year with average weather conditions (source, p.29). A cold year has around 615 more degree days or a 2.15°C lower average temperature (615 / 289 = 2.15). Assuming a linear relationship (as the degree day formula above does), this is a 7.4% increase per degree C below average.
For the year 2017, the temperature dependent L-gas demand is around 49% of total L-gas demand in The Netherlands (source, p.24):
- Total L-gas demand is 25.2 bcm
- Households, buildings and agriculture make up 15.7 bcm of this
- Around 2 bcm is used for cooking, hot water and appliances (temperature independent)
- Around 1.4 bcm is used for electricity generation in agricultural CHPs (temperature independent) (source, p.18)
- This leaves 12.3 bcm out of 25.2 bcm temperature dependent demand
Given the estimated 7.4% increase of total L-gas demand per degree C below average, this means that the temperature dependent part of L-gas demand increases by approximately two times that amount per degree C below average (unrounded: 15.07409694%). Since roughly half of gas demand does not vary with temperature, the other half is twice as sensitive to get an average of 7.4%.
Impact on cooling demand
A temperature change not only impacts heating demand, but cooling demand in households and buildings as well. A higher average temperature leads to a higher cooling demand.
As opposed to heating, the relationship between cooling and temperature is not linear. The ETM assumes the following relationship:
cool_factor = 1.0 + 0.5669449x + 0.1598105x2 + 0.0253755x3 + 0.00163210x4 (where x is the change in temperature in degrees C)
The useful demand for cooling is multiplied with this cool factor.
This formula has been derived using a degree day approach source. To translate a temperature change into a change in useful demand, it is assumed that people will cool their homes when the outdoor temperature rises above 23 °C. The change in useful demand cooling is directly related to a change in degree-days. Figure 1 below shows the temperature measurements in degrees centigrade. Also plotted are the threshold temperatures above which we assume cooling is required (circled area above the green line).
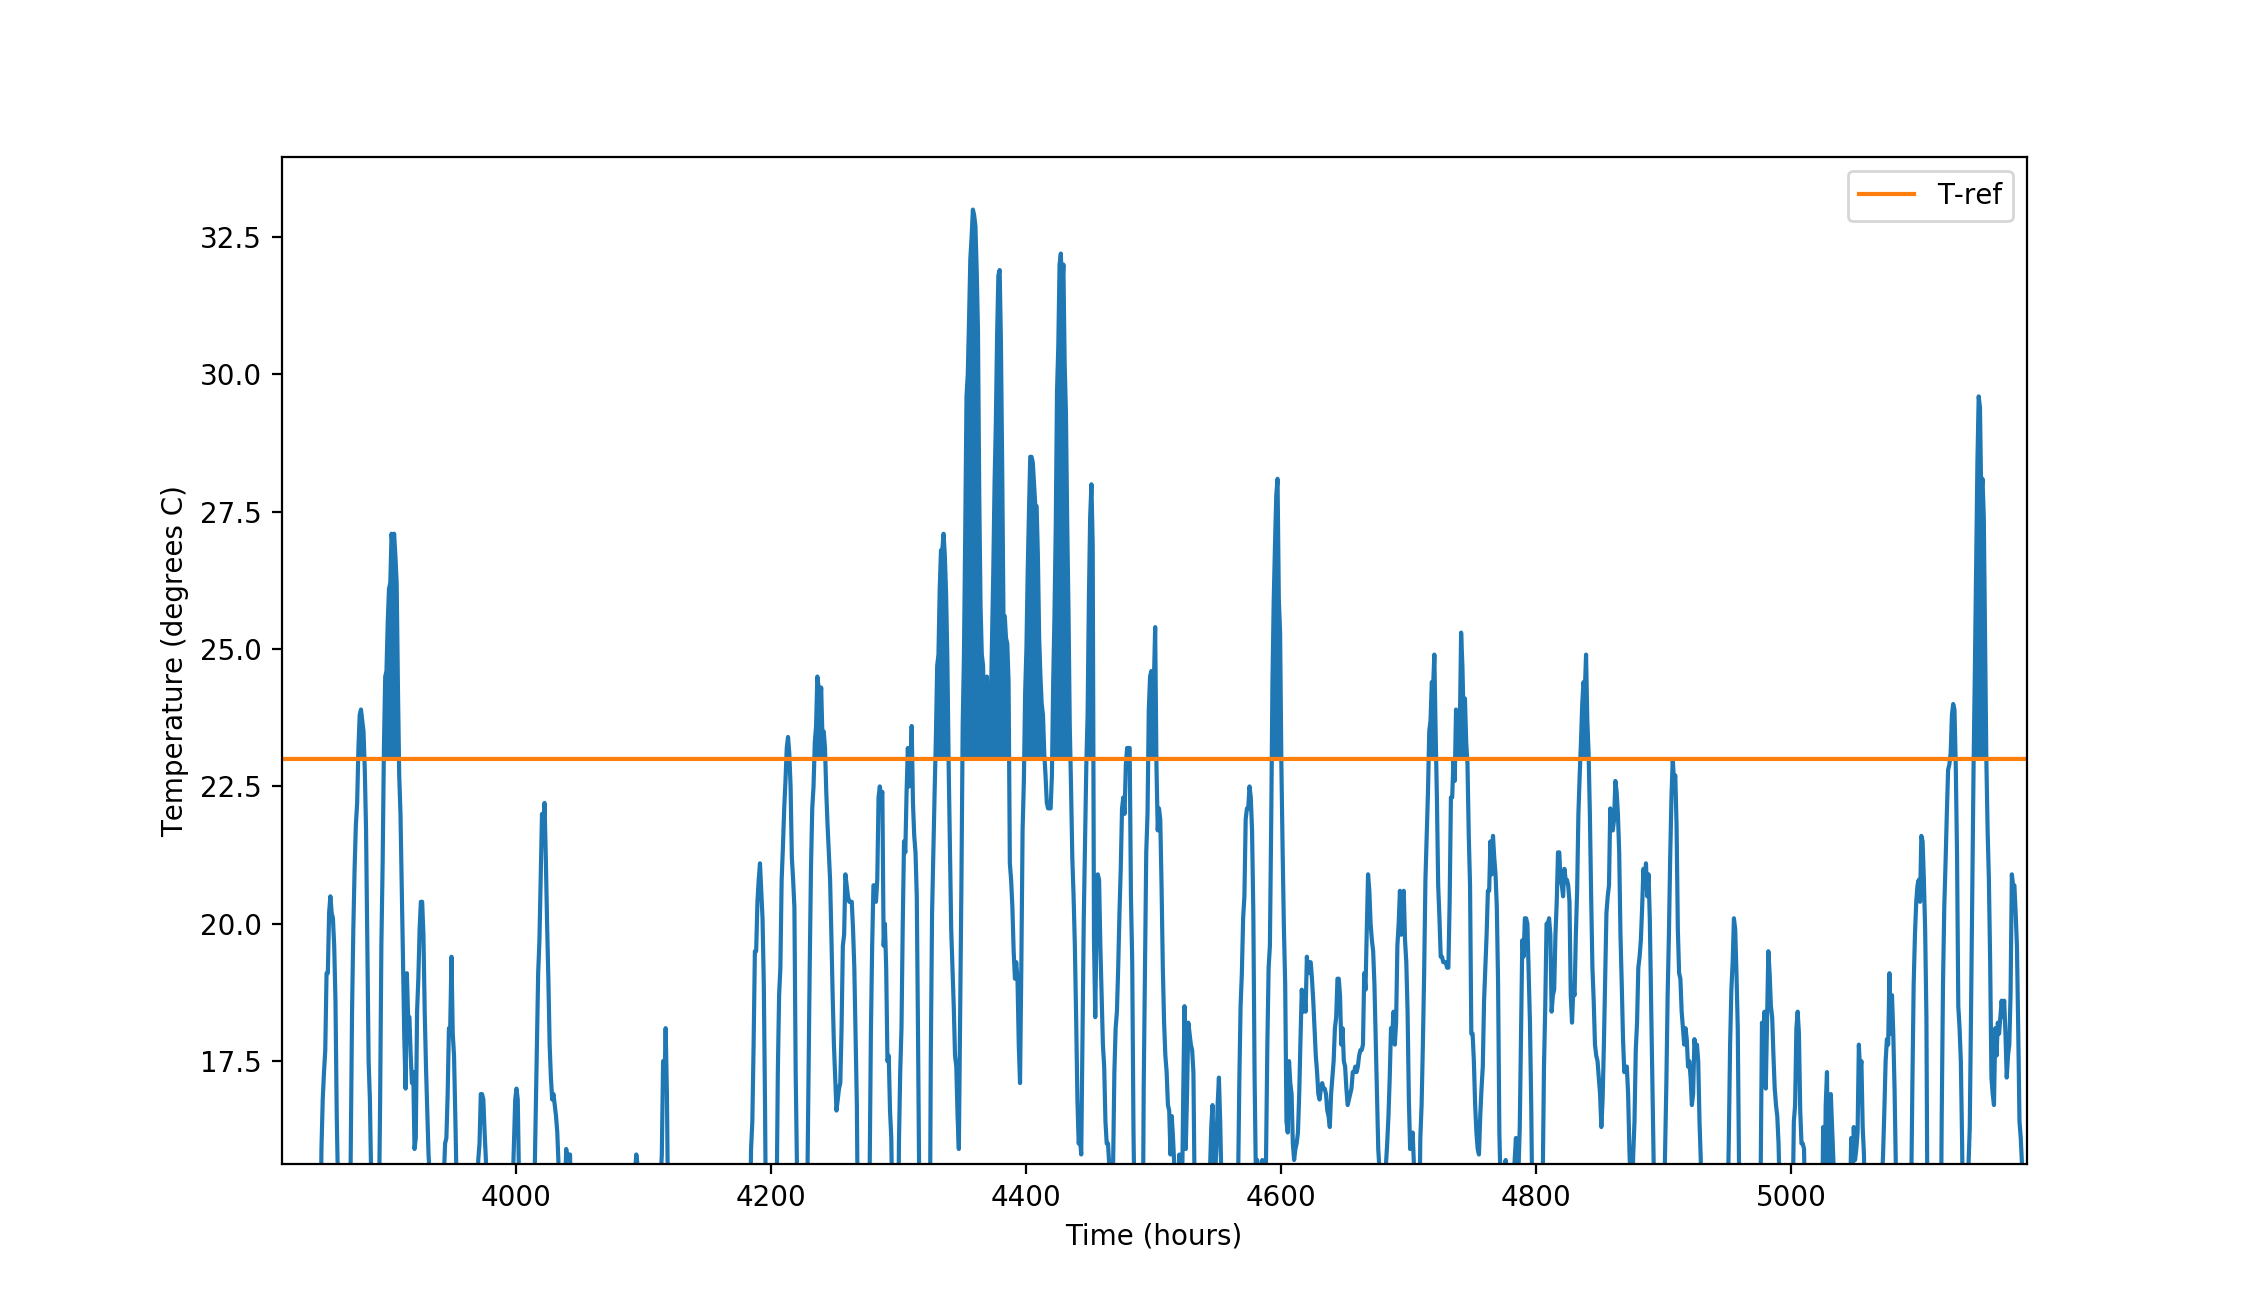 Figure: Temperature curve in the Bilt for 2010
To calculate degree-days for a given temperature threshold, the area between the threshold temperature and the curve is integrated. For cooling this is the area above the 23 degree threshold (green line) and below the curve. Shifting the whole curve up (for increasing outdoor temperatures) or down (for decreasing outdoor temperatures) changes the area above this line and thus the degree-days.