Carbon capture, utilisation and storage
Carbon capture, utilisation and storage (CCUS) is an emissions reduction technology that can be applied across the energy system. This article describes the CCUS features in the ETM.
You can make choices regarding the application of carbon capture, what happens to this captured carbon, how it is transported and the costs associated with it.
Checkout: the negative emissions infopage for more information on negative emissions as an effect of CCUS.
Capture and import
The ETM models five types of sources for supply of CO2:
- Capture in industry
- Capture in the energy sector
- Capture in hydrogen production
- Direct Air Capture
- Import of CO2
For each of the carbon capture technologies, you can make choices about the extent to which it is applied in the future energy system. In addition, you can also set the amount of baseload CO2 that will be imported.
Note that separate choices have to be made about what happens with this CO2 supply. This can be done in the utilisation and storage section. Without making any assumption on demand, any surplus of captured CO2 will be exported (any deficit will be imported). See the Supply and demand of carbon page for more information.
Industry
For various industry sectors, you can make assumptions about the captured amounts of CO2 emissions. The sliders in the model set the share of the total capture potential in a sector that is utilised. For example, if a sector emits 3 Mt of capturable emissions, a slider value of 50% means that in your scenario 1.5 Mt CO2 is captured in that sector.
The capture potential of an industrial sector depends on various aspects. First of all, it depends on the size and efficiency of the sector in the chosen area.
Secondly, it depends on the energy carriers or production technologies used in the sector. For example, a steel sector using conventional blast furnaces has a much lower capture potential than a steel sector using cyclone furnaces. Your choices in the Industry section of the model directly impact the capture potential.
Thirdly, capture potentials can vary per the region chosen in the ETM. More information about the assumed potentials and sources used can be found on ETDataset.
The ETM takes into account the energy requirements of carbon capture technology. To extract CO2 from industrial process and combustion emissions, electricity and heat are needed. The amount of energy used varies per subsector and at what stage CO2 is captured.
Energy sector
Per plant type, you can set the share of installed capacity equipped with carbon capture technology. For example, if installed capacity for pulverised coal power plants is 500 MW, a slider setting of 50% means that 250 MW has a carbon capture unit.
Installing carbon capture units leads to higher investment costs, as well as higher operation and maintenance costs (O&M). In addition, the efficiency of the plant goes down to cover the additional energy required to capture the CO2. The higher O&M and lower efficiency means that the marginal costs of the plant goes up. This may affect the plant's position in the merit order of the power market and hence its number of full load hours. For biomass-fired power plants specifically, it is possible to sell captured biogenic CO2 which in turn can lower the plant's marginal costs.
The energy requirements are modelled as a lower output efficiency of the plant. This means that more coal or gas input is required to produce the same amount of electricity as a regular plant without capture unit.
For the liquid fuel production technologies Fischer-Tropsch and methanol synthesis, it is assumed by default that CCS is applied in the gasification process of the feedstock. Specifically, this is the case for Fischer-Tropsch and methanol synthesis via non-biogenic waste, biogenic waste and dry biomass. Production of these technologies can be set in the Liquid fuels and feedstock section. In contrast to other CCS technologies, there are no sliders available in the CCUS section to set the share of installed capacity equipped with CCS since these processes are not modelled without CCS.
See the Liquid fuels and feedstock documentation page for more information on these processes.
Hydrogen production
CO2 capture at hydrogen production plants works in a similar way as the power sector. The main difference is that for hydrogen, plants are assumed to have fixed full load hours. In other words, there is no 'merit order' that determines which plants produces when. As such, the additional (marginal) costs caused by the capture unit do lead to higher total costs, but do not affect the number of full load hours of the plant.
Direct Air Capture
You can set the amount of CO2 captured by Direct Air Capture (DAC) technology. Direct Air Capture is a process of capturing CO2 directly from the ambient air using electricity.
The ETM assumes DAC units to run base load, i.e. with a flat hourly profile. The electricity required to run DACs is considered final demand of the energy sector. Since DAC is rather energy intensive, the net CO2 reduction depends on the emission factor of the electricity used.
Import of CO2
Carbon import can be an interesting business case for countries that have a proper carbon storage infrastructure. External entities can buy the right to transport emitted carbon to the importing country. You can set the amount of imported CO2 in Mton.
Utilisation and storage
Captured CO2 can be used in multiple ways. The ETM currently offers the following applications:
Storage
CO2 captured in the previous section can be stored long term ('sequestered'), typically in an underground geological formation. The ETM models offshore sequestration in empty oil or gas fields. You can set the amount of CO2 that is stored annually.
The ETM takes into account investment costs, yearly recurring operation and maintenance costs as well as energy requirements for compressing and transporting the captured CO2 to offshore locations.
The maximum storage per year varies per region in the ETM and is based on public research. It is assumed that the maximum storage value per year can be sustained for a period of 40 years. For example, research for the Netherlands indicates that a total of 1680 Mt CO2 can be stored offshore. This comes down to 42 Mt (the slider max) per year over a period of 40 years.
Please note: For some regions, no data could be found on storage potentials. An overview of the research used can be found on ETDataset.
Other utilisation
Finally, you can set the amount of CO2 used for 'other utilisation' purposes. This includes all applications that are currently not modelled explicitly in the ETM. Examples include utilisation of CO2 as a propellant gas for beer and soda production or for the cultivation of crops in greenhouses. CO2 emitted by the fertilizers industry sector can also be captured and used to produce urea, which is used as an animal feed additive and fertilizer.
In many cases, utilising CO2 does not reduce emission, but only delays it. Therefore, the amount of CO2 set with this slider is included in the total emissions of your scenario by default. It is however also possible to delay part of these emissions indefinitely, in which case they are excluded from the total emissions. You can set this share in the Greenhouse gases section.
Synthetic liquid fuels
Note: production of synthetic fuels can be set in the liquid fuels and feedstock section in the ETM. See the Liquid fuels and feedstock section in the documentation for detailed information on all liquid fuel production processes.
Captured CO2 can be re-used to produce synthetic liquid fuels and feedstocks through Fischer-Tropsch and methanol synthesis. These processes use CO2, hydrogen and electricity as inputs to produce fuels and feedstock such as kerosene, methanol, diesel and naphtha. For Fischer-tropsch, baseoload and flexible production routes are available. Dispatchable production is electricity price-driven. See the Electricity conversion page for more information.
Supply and demand of carbon
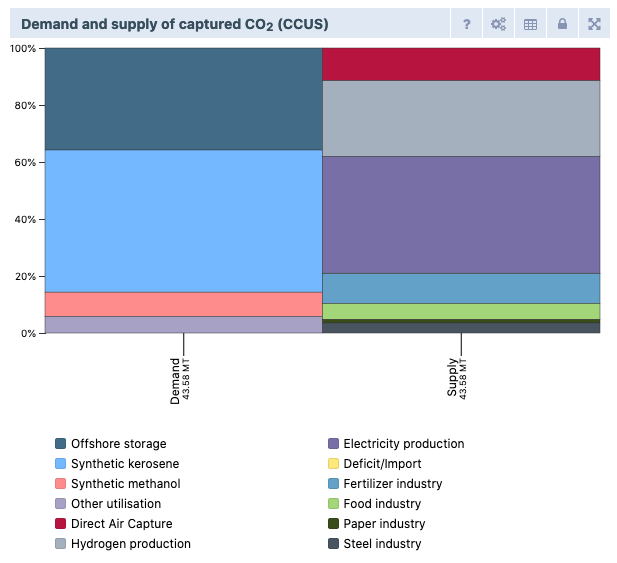
The ETM keeps track of all 'supply' of carbon (capture) and all 'demand' of carbon (utilisation and storage). This is summarised in the chart below:

You can make choices about the supply and demand independently. The ETM registers a carbon 'surplus/export' in case more carbon is captured than is stored or utilised. Vice versa, a 'deficit/import' occurs when less carbon is captured than used for storage and utilisation.
Transport
Carbon can be transported in two different ways in the ETM:
- Via (underground) pipelines
- Liquefied in ships
For each type of infrastructure, you can set the share of total captured CO2 transported. The ETM takes into account the investment costs and operation and maintenance costs.
Since the ETM has limited spatial information, fixed distances and volumes per infrastructure unit are assumed. More information can be found on ETDataset.
Costs
In the Costs & efficiencies section of the ETM, you can make assumptions about changes in CCUS related costs in the future. By default, all CCUS related costs taken into account by the model are based on present-day cost data. This means that the ETM does not automatically assume changes in future costs for CCUS technologies, such as cost development curves. You can also set the cost price for captured biogenics CO2 here. This way, biomass-fired power plants can sell captured biogenic CO2 which in turn will lower their marginal costs.
CCUS graph
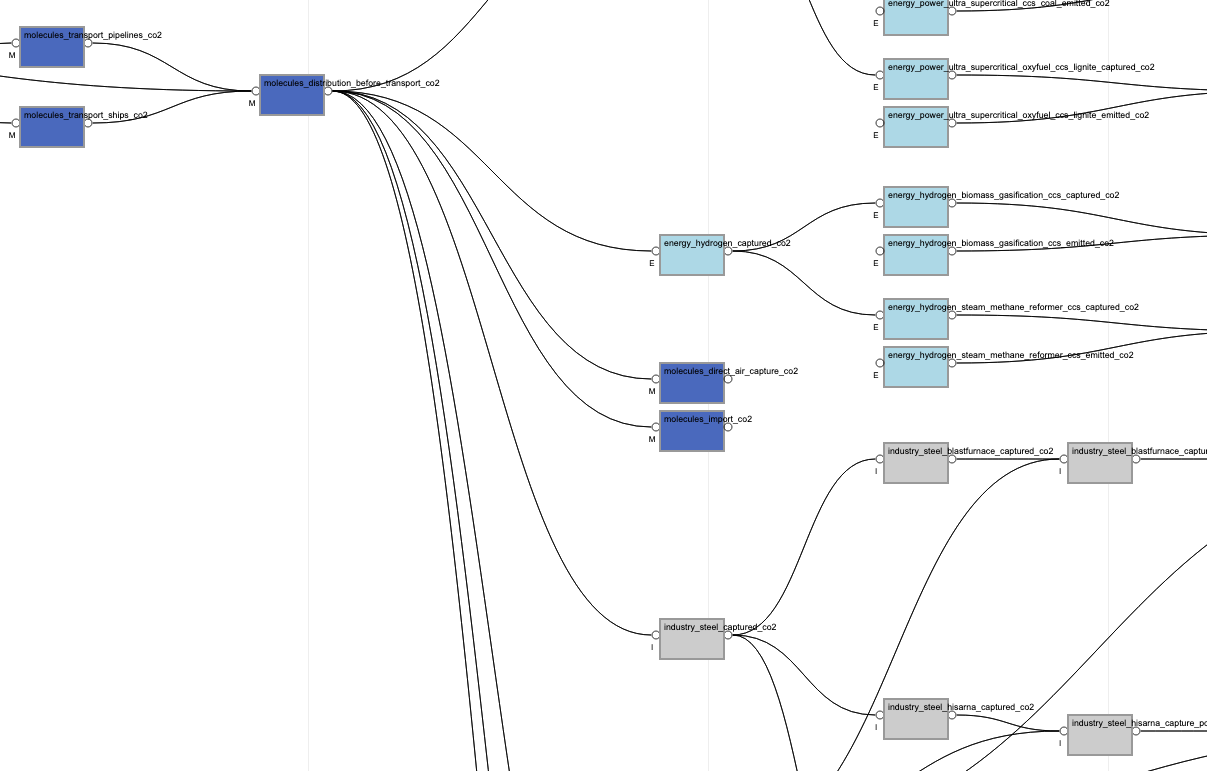
You can find more (advanced) information about the CCUS related CO2 flows in their scenario by opening the 'CCUS graph' in the Visuals section. This is a visual representation of the calculation engine of the ETM. It shows all the carbon sources and destinations taken into account by the model, as well as any 'transformations' in between (such as capture potentials).

The CCUS graph is linked with the energy graph and information is exchanged between the two graphs. In many cases, the 'origin' of a carbon source lies within the energy graph. For example, the amount of CO2 produced by a coal power plant (node: energy_power_combined_cycle_ccs_coal_co2 in the CCUS graph) depends on the installed capacity and full load hours of that plant calculated by the energy graph (corresponding node: energy_power_combined_cycle_ccs_coal in the energy graph). Vice versa, information calculated in the CCUS graph can be relevant for the energy graph. Capturing CO2 in the CCUS graph, for example, leads to additional electricity and heat demand in the energy graph.
By double clicking on any of the 'nodes' in the CCUS graph, a separate pages opens up with more detailed information, such as its 'counter-part' in the energy graph. See the Molecules page in the Contributors section of the documentation for more details.