Heat in the built environment
This page discusses the methods and data used for modelling space heating and hot water.
Building stock
The building stock sets the preconditions for heat in the built environment. It determines the amount of heat needed and is also relevant for which heating technologies can be used to meet the heat demand.
Households (residential)
The ETM distinguishes four housing types:
- Apartments
- Detached houses
- Semi-detached houses (not available for all country datasets in the ETM)
- Terraced houses
Each housing type is then split into construction periods:
- Before 1945
- 1945 – 1964
- 1965 – 1984
- 1984 – 2005
- 2005 to present (where present is the start year of the simulated region)
- New residences (built between the start year and end year)
The sources used for the existing housing stock data can be found in the ETM Dataset Manager.
Buildings (non-residential)
The building stock within the buildings sector is used to provide a wide range of services, from hospitals to offices or swimming pools, making it difficult to capture the sector in a limited number of categories. Therefore, no different building types are distinguished.
There is limited reliable data available about construction periods for buildings. Therefore, the building stock is split into only two categories:
- Existing buildings
- New buildings (built between the start year and end year)
The sources used for the existing building stock data can be found in the ETM Dataset Manager.
Heat demand
Space heating demand and insulation
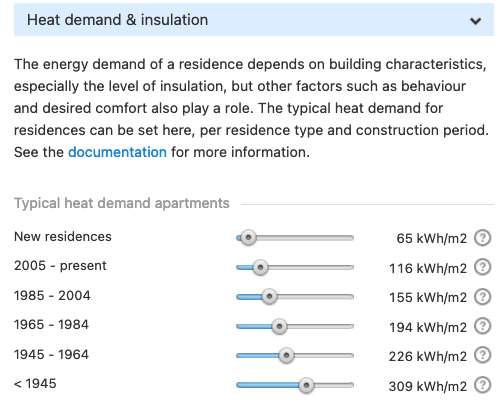
Insulation can be used to reduce the amount of heating needed for houses and buildings. The ETM allows you to alter the heat demand for various types of residences and non-residential buildings separately in the Household or Buildings sections.
For the start year, the heat demand for space heating follows from the region’s dataset. The sources for these data can be found in the ETM Dataset Manager. This data is translated to the slider settings for space heating and hot water.
For the future year, the ETM uses the typical heat demand sliders to recalculate the heat demand for space heating. The typical heat demand in the ETM reflects the average insulation level of a house or building category and is expressed in kWh/m2. The source for the typical heat demands in the starting year can also be found in the ETM Dataset Manager.
The ETM uses these sliders in two different ways:
-
For existing housing/building stock, the slider value is used to scale the heat demand for space heating from the start year. In other words, adjusting the slider value results in a relative change of heat demand for space heating compared to its starting value.
Example: In the image above, the typical heat demand for apartments built between 1985-2004 has a starting value of 155 kWh/m2. Reducing the typical heat demand to 124 kWh/m2 (a reduction of 20%) means that the heat demand for space heating is decreased by 20% in the simulated future year. -
For new housing/building stock, the actual slider value is used to calculate the future heat demand for space heating, based on an average surface area per newly built unit.
Example: In the image above, the typical heat demand for space heating for new apartments is set at 65 kWh/m2. The starting value of the number of new residences is set to 0 by definition. If the number of new residences is set at 100,000, the heat demand for space heating increases by 100,000 apartments x 65 kWh/m2 x 84 m2/apartment.
Please note that, the typical heat demand slider values cannot be used to calculate the useful heat demand for existing building stock. There are two reasons for this:
- The starting year values for the typical heat demand values are typically not derived from the actual heat demand for space heating data. In fact, they are often derived from different sources entirely.
- As mentioned above, the future year values of the typical heat demand sliders are only used as a scaling factor. Unlike for new residences/buildings, the actual slider value is not used to calculate heat demand in the future year.
Additionally, the typical heat demand sliders are used to calculate insulation costs. See the Costs section for details on this topic.
Hot water
The demand for hot water is only defined for households. Residences of all housing types and build years are assumed to have the same hot water demand, since it is assumed to depend mostly on human behavior. The behavioral impact on hot water demand can be altered using the corresponding slider under the Development of demand section.
Solar thermal panels
Solar thermal panels in households are only used to meet hot water demand. They can be used to meet up to 100% of demand using the corresponding slider. The remaining demand is then met using the specified mix of technologies for space heating and hot water.
Solar thermal panels in buildings are used to meet space heating demand, but only up to 13% of demand. The remaining demand is then met using the specified mix of technologies for space heating.
Technologies for space heating and hot water
A wide range of technologies is available to meet the space heating and hot water demand. Each slider sets the share of the total housing or building stock that is supplied by a particular technology.
- For households, a single technology is assumed to provide both space heating and hot water in a residence.
- For buildings, a technology only provides space heating, since the ETM does not specify hot water demand for buildings.
It is not possible to directly specify the technology mix for each housing or building category. Instead, technologies are assigned to housing/building categories through a so-called merit order. A prioritized mix of technologies is assigned to housing/building stock first by build year, and for housing stock subsequently by housing type: first apartments, then terraced houses, semi-detached and finally detached houses. This order roughly follows the useful heat demand in increasing order, i.e. new apartments have a lower useful heat demand than detached houses from before 1945. The consumer order is therefore fixed as follows:
| Housing stock | Building stock |
|---|---|
| New apartments | New buildings |
| New terraced houses | Existing buildings |
| New semi-detached houses | |
| New detached houses | |
| Apartments from 2005 - present | |
| Terraced houses from 2005 - present | |
| ... |
The prioritized mix of technologies is called the producer order. Although it is fixed for buildings, the producer order for space heating in households can be adjusted by the user under the Households merit order section.
The merit order then works by assigning the first technology in the producer order to the first consumer in the consumer order (i.e. new apartments for households), then to the next consumer, and so on. This process continues until the specified share of residences for the first technology has been reached. The ETM then continues this process with the second technology in the producer order, until ultimately all housing/building stock is assigned a technology based on the specified technology shares.
A chart is available that visualizes the resulting number of residences per space heating technology.
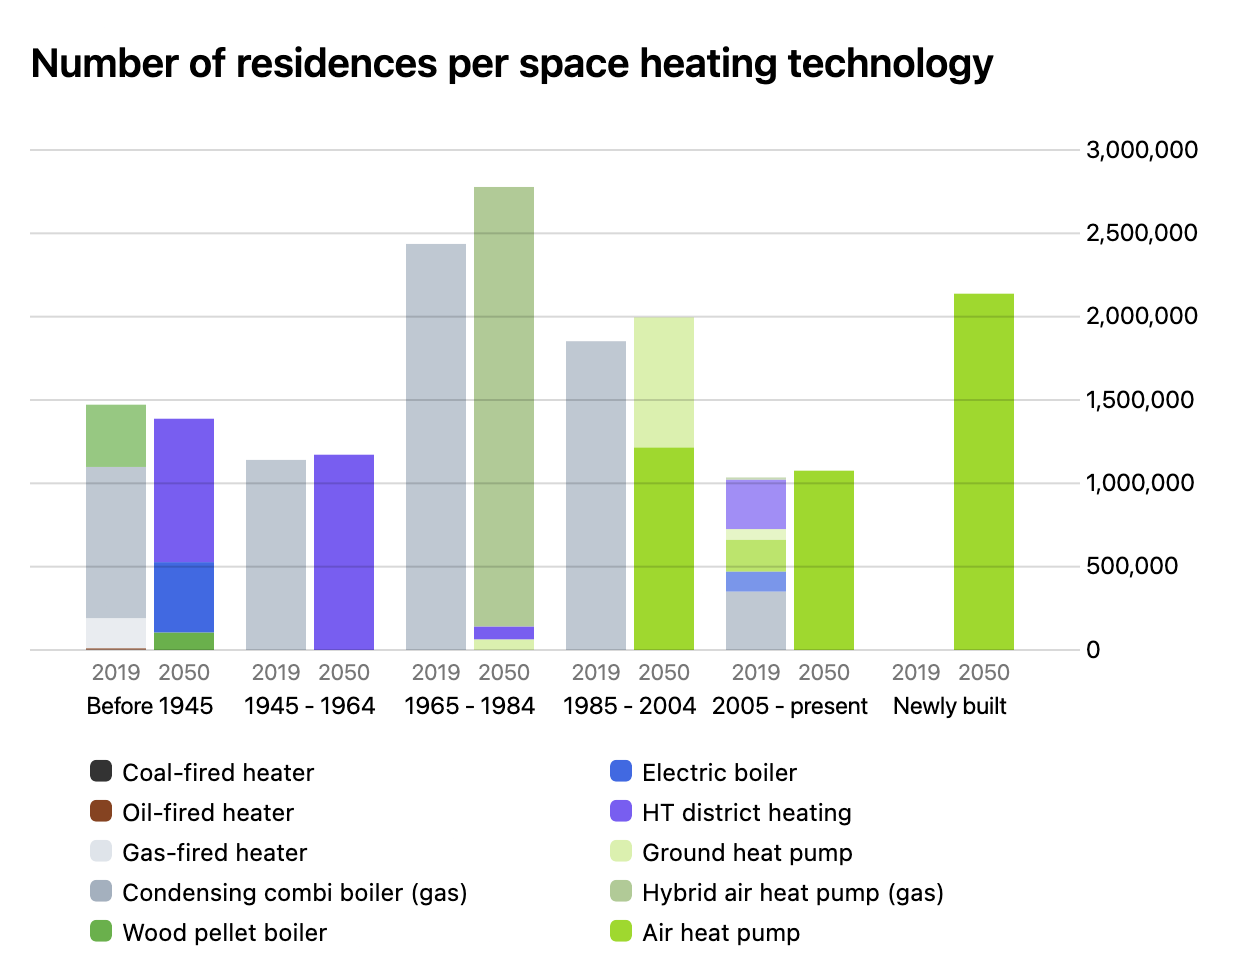
Note that a housing category can be matched with more than one heating technology. In the chart above, the housing construction period 1985-2004 is split between air heat pumps and ground heat pumps, whereas newer residences have only been assigned air heat pumps. The reason for this is that the specified share of residences with an air heat pump was reached sometime during the 1985-2004 category, upon which the ETM switched to the next technology in the merit order, that is, ground heat pumps.
Matching heat demand with supply
The ETM matches demand for space heating and hot water with supply on an hourly basis. It does this for both the starting year and the simulated end year. How this proces works for the starting year can be found in the section Built environment heat initialization. Below the process for the simulated end year is described.
Hourly demand is determined by the combination of annual heat demand and a housing/building category specific heat demand curve. The annual heat demand for water heating is considered separately from that of space heating. The heat demand curve is then applied to convert the annual demand to hourly demand profiles. This results in the following hourly demand profiles:
- Buildings: one heat demand profile for buildings;
- Households water heating: one water heating demand profile for households;
- Households space heating: for each housing type (apartments / terraced / semi-detached / detached), the ETM contains a demand profile for high, medium and low levels of insulation. These are matched with build year categories as follows:
- high insulation: 'new' and '2005-present' residences;
- medium insulation: '1965-1984' and '1985-2004' residences
- low insulation: '1945-1964' and 'before 1945' residences.
The ETM thus contains 12 heat demand profiles in all. See the ETDataset repository for details on these profiles.
Hourly supply is based on the heat capacities of all available heating technologies. The heat capacity of each technology, measured in kW, represents the maximum amount of heat a technology can provide at a given moment. These heat capacities are only user-adjustable for space heating in households, under the Households merit order section.
To match demand with supply, the ETM compares the heat demand profile of each housing/building category with the heat capacities of the assigned technologies:
- If supply exceeds demand for an hourly interval, the given technology / technologies have sufficient capacity to provide the required heat.
- If not, the ETM allows for a slight shift in demand through buffering and time shifting. In practice, this means that the ETM can delay demand by four hours.
- If demand then still exceeds supply, a heat deficit is registered.
For households, there is a table available that lists the total annual heat deficits per housing category.
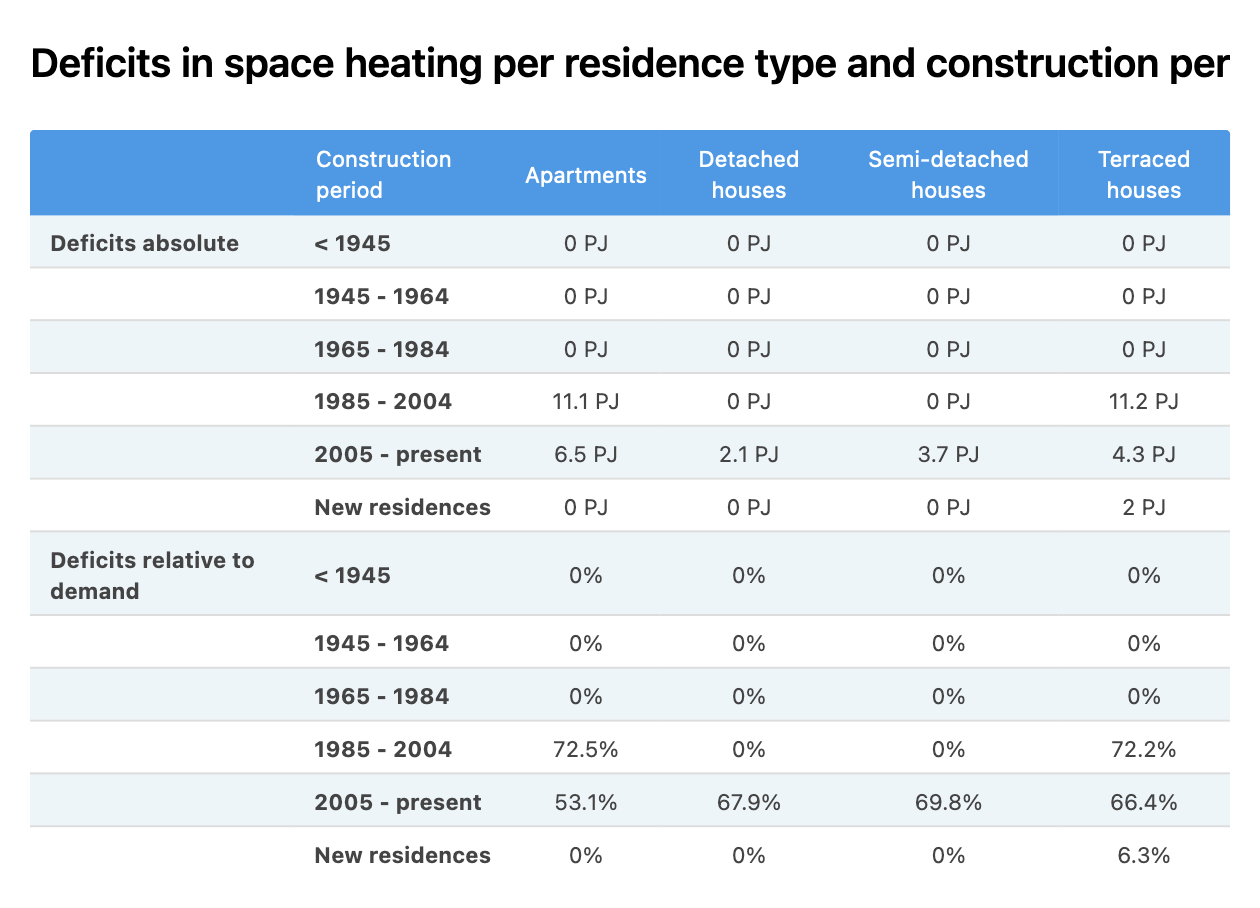
The table does not specify which technology causes the heat deficits. However, the combination of the table and the number of residences per technology chart gives you an indication of the source of the problem. In the images above, for example, the large deficits in the ‘2005 – present’ build year category indicate that the air heat pump might have insufficient heat capacity.