Insulation costs
In the ETM interface, insulation is set using a single slider per construction period for houses and buildings. This slider only shows a percentage, from 0% (no additional insulation) up to 100%. To calculate the insulation costs, the ETM keeps track of a typical heat demand for each housing or building category, expressed in kWh/m2 (see the Heat in the built environment section). The insulation slider reduces this typical heat demand by the percentage entered, compared to its value in the starting year: a slider set to 20% reduces the typical heat demand for that category by 20%.
It is this resulting, reduced typical heat demand that is used to calculate insulation costs, as described below.
In line with the greenfield approach for costs, the ETM only assumes costs for investments required in the future. Insulation costs are therefore added when the insulation is increased and with that the heat demand is reduced compared to the current situation; if not, then the insulation costs are zero.
Households
The insulation costs for houses are based on the Ecofys report 'De systeemkosten van warmte voor woningen (2015)'. This report distinguishes three levels of insulation – low, medium, and high – and specifies the investment costs for transitioning from one level to another. The table below shows the insulation costs for existing housing stock of different categories. The ETM uses the 2020 costs for the four different housing types.
Insulation costs in euros excluding VAT
| Housing type | Insulation costs from low to medium in €/residence | Insulation from medium to high in €/residence |
|---|---|---|
| Apartments | 5800 | 12000 |
| Detached houses | 14200 | 35200 |
| Semi-detached houses | 10300 | 24800 |
| Terraced houses | 7200 | 16000 |
To arrive at insulation costs, the three levels of insulation have been mapped to typical heat demand levels. This mapping is based on the relation between the Dutch energy performance indicators and the annual primary fossil energy consumption BENG 2 (see Lente-akkoord.nl).
Insulation level mapping to typical heat demand
| Insulation level low in kWh/m2 | Insulation level medium in kWh/m2 | Insulation level high in kWh/m2 | |
|---|---|---|---|
| Typical useful demand | 118 | 220 | 403 |
Typical useful demand per insulation level and typical costs to transfer to a higher insulation level are combined to define two insulation cost categories for every housing type: high and low. These levels determine insulation costs in €/(kWh/m2).
The total insulation costs per residence are calculated by multiplying the heat demand reduction per insulation category with the amount of insulation in that category.
The total insulation costs for a housing category are calculated by multiplying the insulation costs per residence by the total number of residences in that category.
Insulation costs mapping example for terraced houses
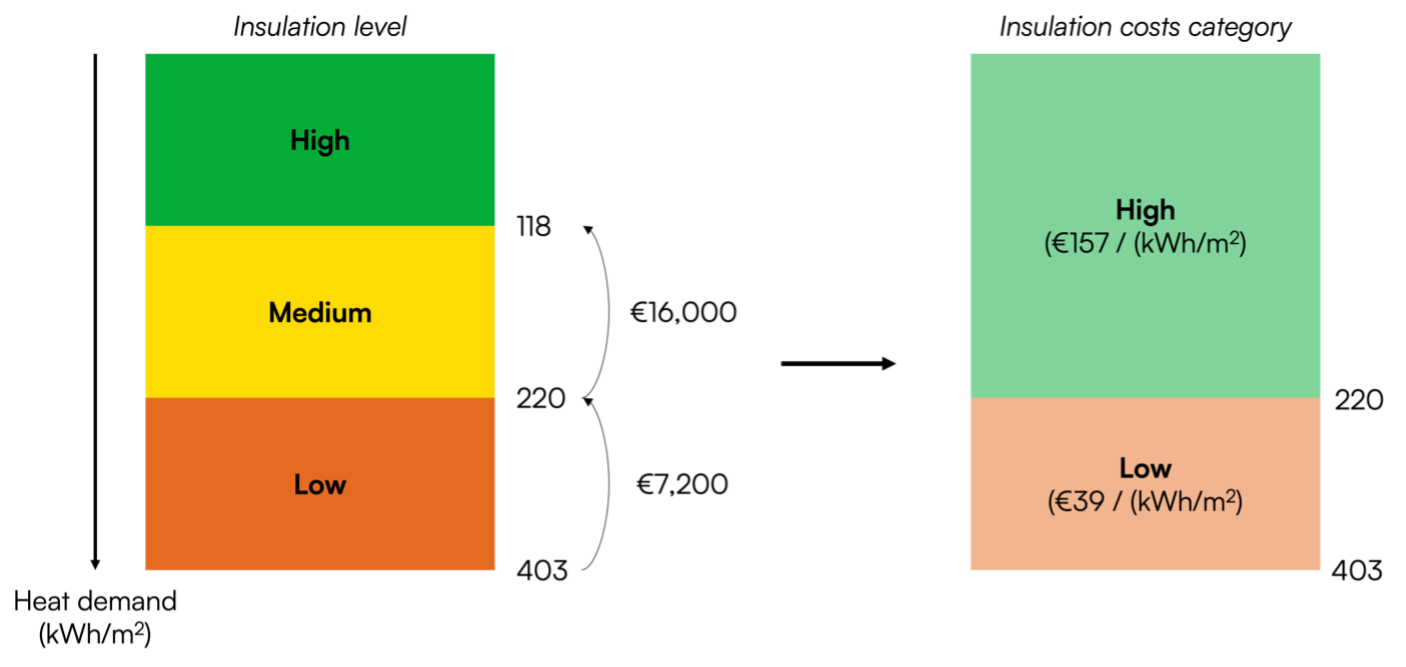
Example: 1000 terraced houses with a typical heat demand of 350 kWh/m2 are insulated to a typical heat demand of 100 kWh/m2. The insulation costs amount to:
- Insulation in category "low": (350 kWh/m2 - 220 kWh/m2) x 39 €/(kWh/m2)= €5,070
- Insulation in category "high": (220 kWh/m2 - 100 kWh/m2) x 157 €/(kWh/m2)= €18,840
- Total per residence: €23,910
- Total insulation costs: €23,910,000
Buildings
The insulation costs for buildings follow the same procedure as described above for households. The costs figure for buildings are based on the tussenwoning figures from the Ecofys report, i.e.:
| Insulation costs from low to medium in €/(kWh/m2) | Insulation from medium to high in €/(kWh/m2) | |
|---|---|---|
| Existing building stock | 39 | 157 |
For new building stock insulation costs of €157/(kWh/m2) are used for additional insulation.