Loss of load expectation
The Loss Of Load Expectation (LOLE) is the expected number of hours per year that a country's electricity production park cannot meet its demand. The LOLE is also calculated in the ETM and displayed in the dashboard.
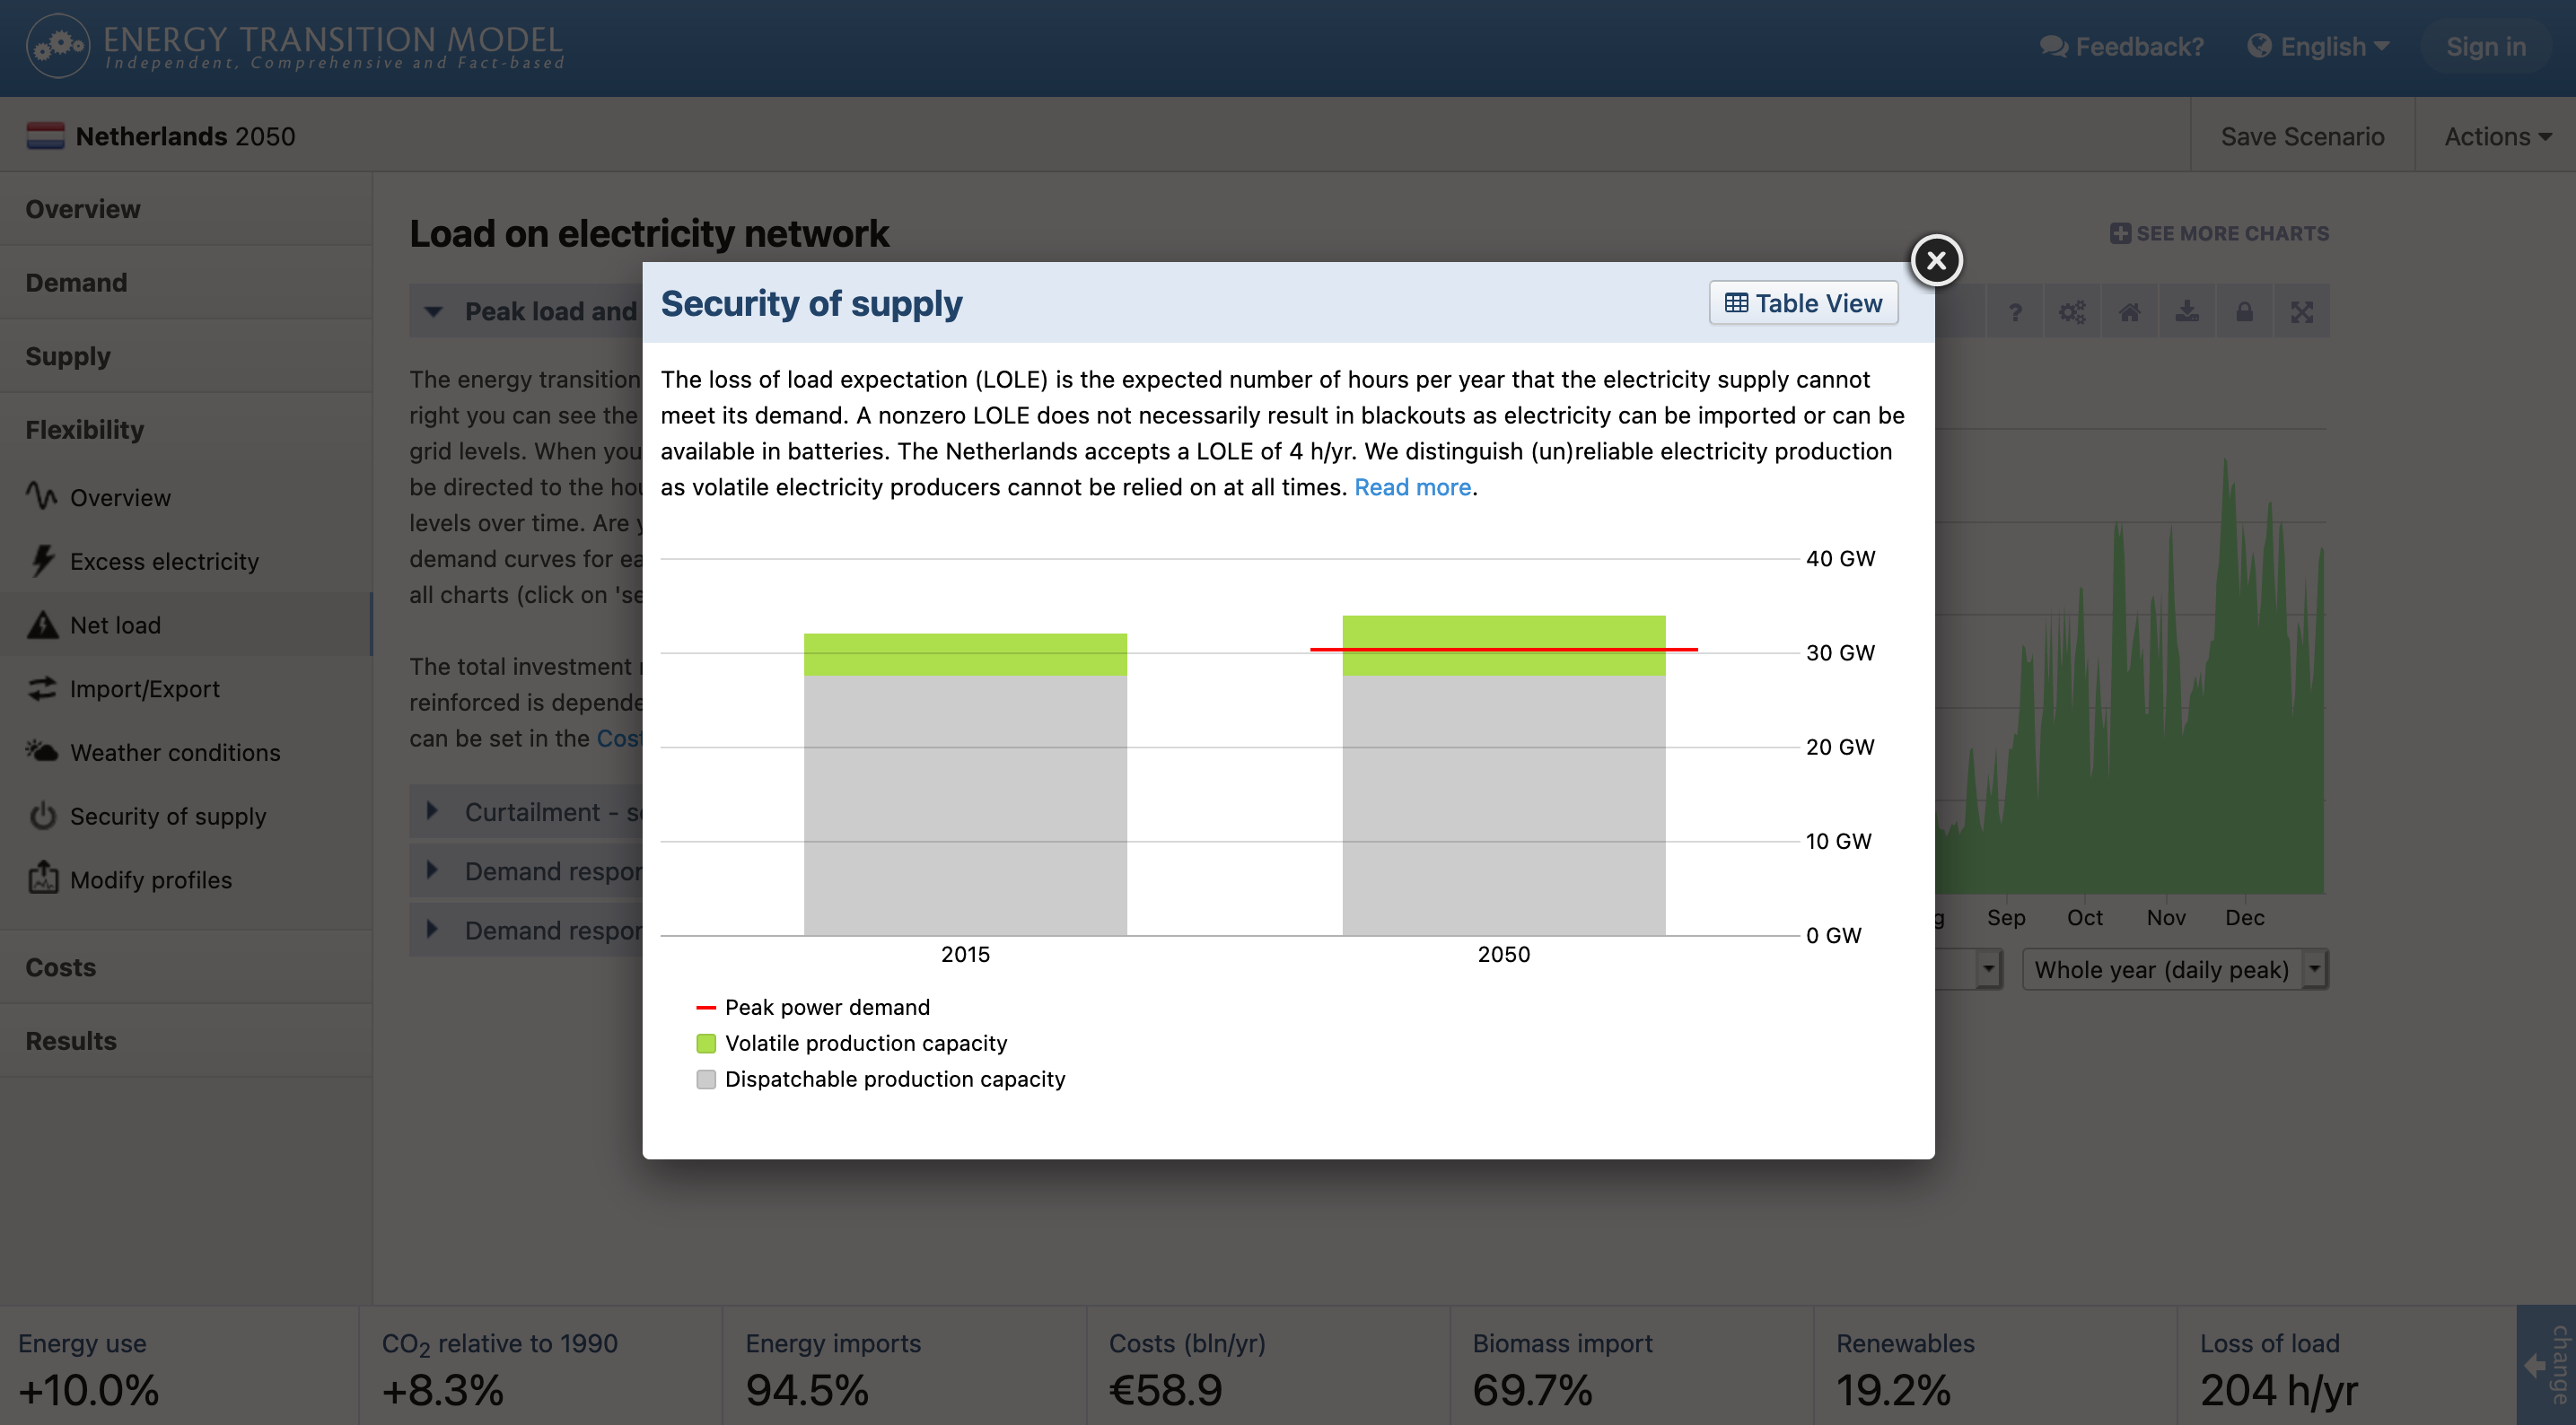
The LOLE is an important consideration when planning a power system and similar, but more elaborate, versions of this calculation are conducted by the Transmission System Operators of a country (see e.g. TenneT, 2012). A nonzero LOLE does not necessarily results in blackouts as electricity can be extracted from storage or imported from neighbouring countries. TenneT's brief allows a LOLE of 4 hours/year, but each country may have slightly different standards.
By displaying the LOLE in the ETM, you can see whether there is a sufficiently dispatchable electricity production that can meet the expected demand at all times of the year. This reminds you of the importance of having backup capacity, especially if scenarios have significant shares of volatile energy technologies.
This page explains how the LOLE is calculated within the ETM.
Working with LOLE in the ETM
The Energy Transition Model contains typical hourly production profiles for volatile electricity producers. This volatile electricity production is subtracted from the hourly electricity demand and the peak electricity demand is determined. This peak electricity demand is compared to the available dispatchable production capacity. If the peak demand exceeds the dispatchable capacity, the loss of load expectation increases. To decrease the loss of load expectation, reliable capacity needs to be installed or the demand needs to be reduced.
Calculating the LOLE
Several methods exist for calculating the loss of load expectation. The ETM has a basic approach to decrease the response time needed for calculations. The following data is used:
- Country specific hourly load profiles - see this section for the sources of these profiles
- Total yearly electricity demand - taken from the ETM based on user decisions
- Installed electricity production capacity for all electricity producers - taken from the ETM based on user decisions
- Availability of all electricity producers - taken from the ETM, several sources
In short, the calculation consists of the following steps.
- Determine the total electricity demand profile
- Determine the total electricity (volatile) production profile
- Subtract total electricity demand profile from the total electricity production profile resulting in a residual demand profile
- Calculate dispatchable production capacity
- Compare the residual demand profile and the dispatchable production capacity and determine LOLE
Below, step 3, 4 and 5 are further explained:
3. Subtract volatile production from demand profile
Volatile electricity cannot be relied on at all times, but when it is available it will be used. We model this is the ETM by subtracting all volatile electricity production profiles from the demand profile. The result is a residual load profile.
4. Calculate dispatchable production capacity
Not all electricity production can be relied on at all times. Dispatchable and volatile electricity supply are distinguished in the ETM. Dispatchable production capacity can be relied on at all times, except for when a plant is down for maintenance. This is taken into account by researching the availability for all plants. The dispatchable production capacity is then defined as
dispatchable_production_capacity = installed_capacity * availability.
The total dispatchable production capacity is simply the sum of the dispatchable production capacity for all dispatchable producers.
5. Determine LOLE
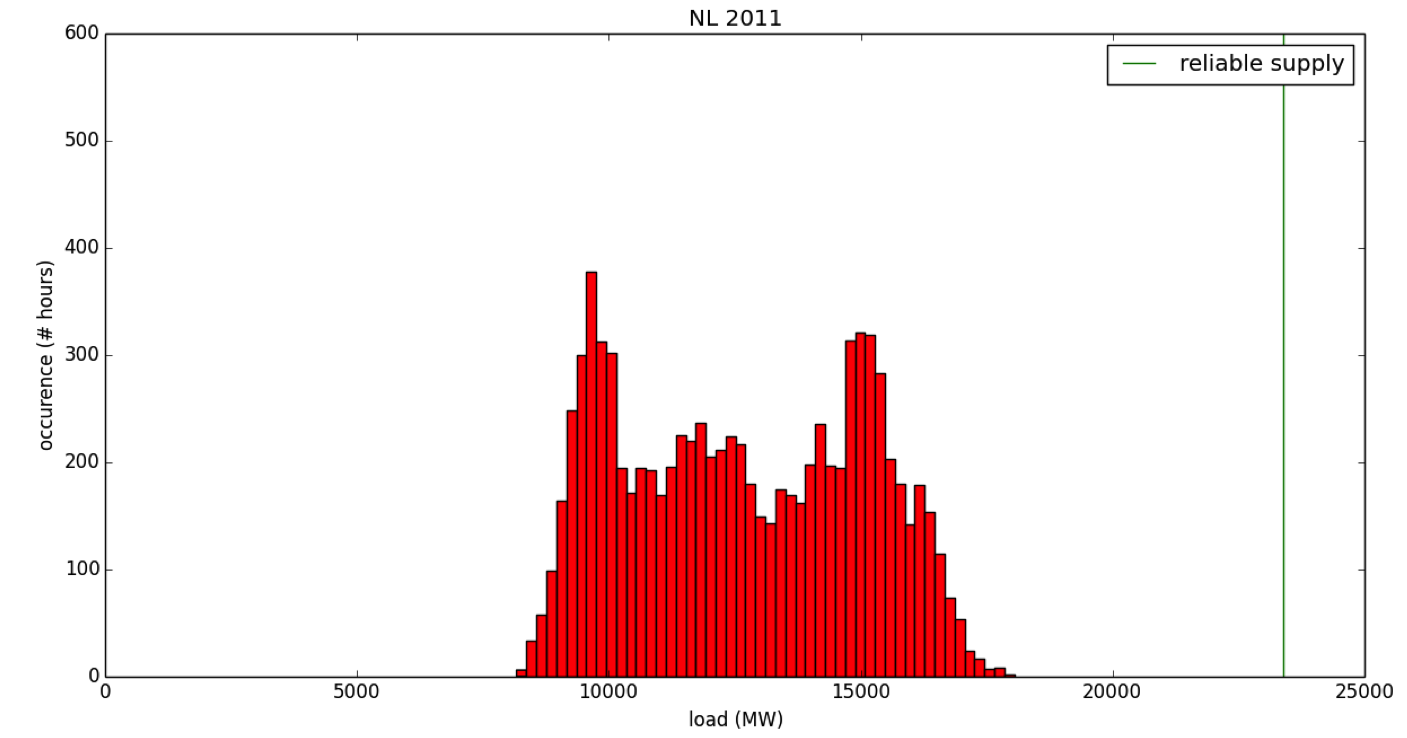
The residual hourly load profile consists of 8760 data points, representing the residual average hourly load for each hour of the year. We compare each of these 8760 hours to the dispatchable production capacity that was calculated above, and determine at how many of these hours the load exceeds the dispatchable production capacity. This number of hours is defined as the LOLE. The figure below shows a graphical representation of the LOLE calculation. For clarity, the load profile has been represented as a histogram (red). The reliable production capacity is shown as a green line. In this particular case, the LOLE is equal to zero as none of the events in the histogram are to the right of the green line.
Discussion
The following aspects of the current LOLE implementation can be improved on and should be subject of further study.
- The LOLE calculation does not take into account ramping times of electricity producers.
- An alternative method to calculate the LOLE is described by Ofgem. This method is based on convolution of the load profile and generation profiles of conventional generation and typical electricity generation distribution of wind turbines. This method could be extended to include solar PV, however, the calculation time is too high to include it within the model.
Sources: IEA Wind Task 25 (IEA, 2009) and 'Reconsidering the Capacity Credit' (Wilton, 2013)