Profiles
Introduction
The ETM uses hourly profiles to model demand and supply of electricity, hydrogen and gas. The hourly demand and supply is determined using the annual demand and supply and a given hourly profile. Datasets in the ETM have default profiles, which are obtained from verified sources including climate databases, energy system operators and research institutions. It is possible to overwrite the default profiles by uploading custom profiles in the ETM in Modify profiles.
This page gives an overview of the type of profiles and explains how to modify these profiles.
Types of profiles
The profiles used in the ETM can be categorised as demand profiles, supply profiles and other profiles. Within these categories, there are five different profile types that determine how the profiles behave and are processed by the model.
The following profile types can be uploaded:
-
Regular profiles. These profiles are typically used for demand profiles and represent the fraction of annual demand used in each hour of the year (8760 hours) for a specific category. The unit used in the uploaded curve file does not matter: the model uses the shape of the profile (the relative distribution of demand over time). For example, if the profile sums up to 500 and the first hour has a value of 5, 1% of the annual demand for this category is assigned to the first hour.
-
Capacity profiles. These profiles are typically used for supply profiles (such as solar PV and wind) and represent the fraction of installed capacity used for each hour of the year for a specific production technology. For example, a value of 0.5 means that 50% of peak capacity is utilised in that hour. The sum of all hours should equal the total annual full load hours of that technology. Note that a capacity profile is also used for the must-run interconnectors import and export profiles.
-
Price profiles. These profiles are used for the interconnector prices and represent the price for each hour of the year. The unit is €/MWh and the value for each hour will be rounded to the nearest whole cent.
-
Availability profiles. These profiles are used for interconnector import and export availability and represent the availability of the interconnector for each hour of the year. Values should be specified between 0 and 1 for each hour, where for example 0.5 means that 50% of the capacity is available, 0 that no capacity is available or 1 that all capacity is available.
-
Temperature curve. Used to set the air temperature profile and represents the outdoor air temperature for each hour of the year. The unit is degrees Celsius.
Weather-dependent profiles
The ETM supports different weather years that change weather-dependent profiles, such as heating demand and renewable electricity production from solar PV and wind, to the profile of a specific historic year.
Uploaded custom profiles always take priority over a standard weather year profiles. If a specific weather year is selected, this will only affect weather-related profiles for which no custom profile is uploaded.
The weather year functionality is currently only available for Dutch regions.
Overview of profiles
Below, the profiles in the ETM are specified in categories demand, supply and other profiles. More information about the country-specific profiles can be found on the profiles (curves) section in ETDataset.
Demand profiles
| Sector | Sub-sector | Profile type | Weather-dependent | Additional information |
|---|---|---|---|---|
| Households | Space heating | Regular | Yes | Split up in individual profiles per residence type and construction period (see Matching heat demand and supply) |
| Hot water | Regular | No | ||
| Cooling | Regular | No | ||
| Appliances, lighting, cooking | Regular | No | ||
| Buildings | Space heating | Regular | Yes | |
| Cooling | Regular | No | ||
| Appliances | Regular | No | ||
| Transport | Electric cars | Regular | No | 5 different profiles available: charging everywhere, home charging, fast charging, smart charging, regular charging |
| Passenger trains, trams/metro, electric bicycles, motorcycles | Regular | No | Uses "charging everywhere" profile pattern | |
| Electric buses, electric trucks, freight trains | Regular | No | Uses "charging at home" profile with night-time peaks | |
| Hydrogen trucks, buses, cars | Regular | No | Flat profile (constant demand) | |
| Industry | Heating demand (Food, Paper, Other sectors) | Regular | No | |
| Electricity demand (Food, Paper, Other, ICT sectors) | Regular | No | ||
| Heating and electricity (all other sectors) | Regular | No | Flat profile (contant demand) | |
| Agriculture | Electricity | Regular | No | |
| Heat | Regular | Yes |
Supply profiles
| Sector | Sub-sector | Profile type | Weather-dependent | Additional information |
|---|---|---|---|---|
| Renewable | Solar rooftop (households) | Capacity | Yes | Based on measured climate data and/or country-specific solar PV production data |
| Solar rooftop (buildings) | Capacity | Yes | Based on measured climate data and/or country-specific solar PV production data | |
| Solar on land | Capacity | Yes | Based on measured climate data and/or country-specific solar PV production data | |
| Solar offshore | Capacity | Yes | Based on measured climate data and/or country-specific solar PV production data | |
| Solar thermal | Capacity | Yes | Based on measured climate data and adjusted for solar thermal behavior characteristics | |
| Wind | Capacity | Yes | Based on measured climate data and/or country-specific wind production data | |
| Other: geothermal heat, geothermal electricity, hydropower, biogas CHP, waste incinerator | Capacity | No | Flat profile (constant output) | |
| Other | Dispatchable technologies (renewable and conventional) | - | No | Flat profile (constant output) |
Other profiles
| Sector | Sub-sector | Profile type | Weather-dependent | Additional information |
|---|---|---|---|---|
| Air temperature | Air temperature | Temperature | Yes | |
| Import/export | Interconnector import/export must-run | Capacity | No | Individual profiles per interconnector |
| Interconnector import/export availability | Availability | No | Individual profiles per interconnector | |
| Interconnector price | Price | No | Individual profiles per interconnector | |
| Hydrogen import/export | Regular profile | No | ||
| Gas import/export | Regular profile | No |
Custom profiles
Uploading custom profiles
To upload a custom profile:
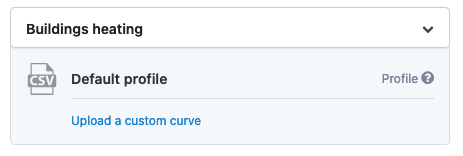
- Navigate to the Modify profiles section
- Select the specific profile from the dropdown menu
- Click 'Upload a custom curve' and provide a CSV file
- Ensure the CSV fiel contains exactly 8760 rows (one per hour) with numeric values
The CSV file should follow this simple format:
23.64
32.71
32.65
32.71
30.89
...
See Types of profiles for the value requirements per profile type.
Understanding results
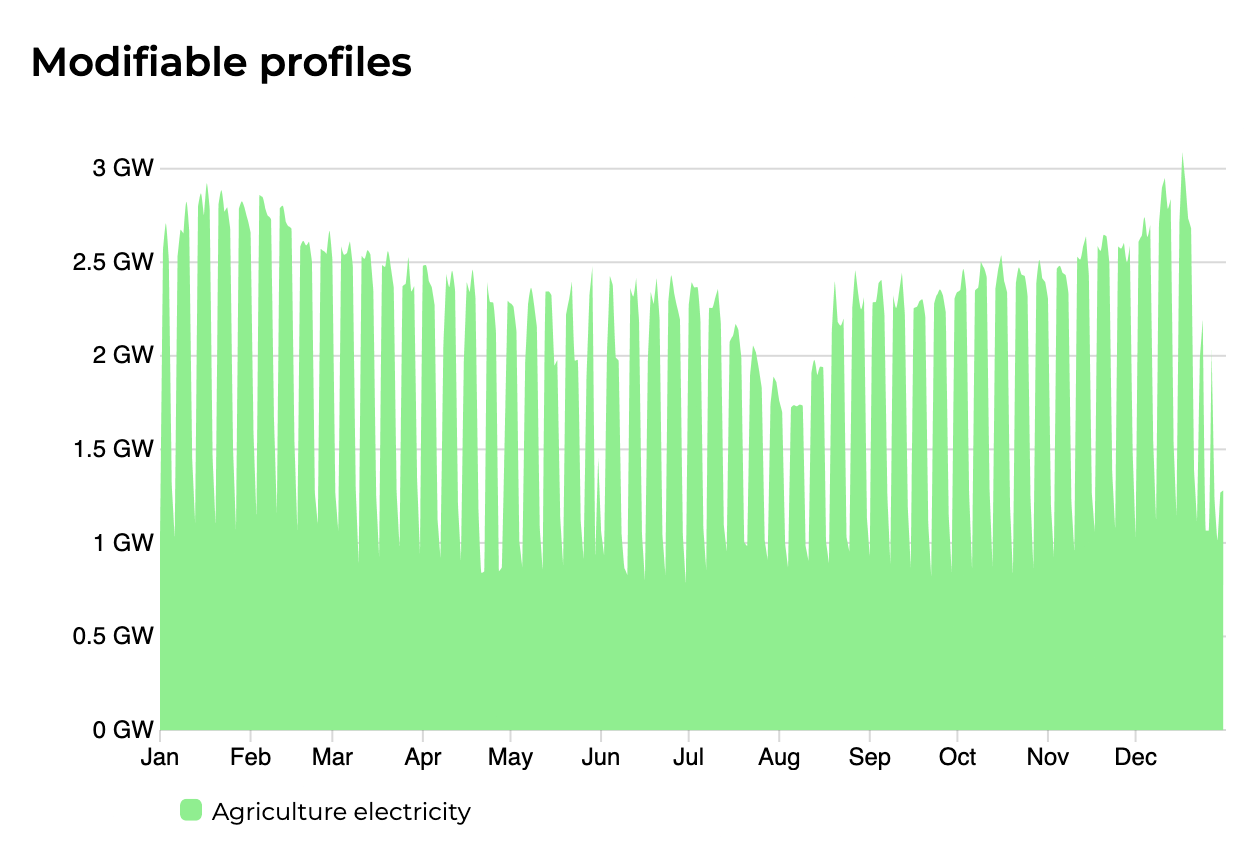
The ETM processes uploaded profiles and calculates resulting hourly energy flows. Note that the chart 'Modifiable profiles' shows these calculated results, it does not show the raw uploaded profiles. For example: if a capacity profile for offshore wind is uploaded, the chart displays the resulting deployed capacity in MW for each hour, and not the fraction of installed capacity that was uploaded.
Downloading profiles
Custom profiles uploaded to a scenario can be downloaded as well in the same section. Note that regular profiles are always downloaded as a normalised profile remaining the original shape of the profile. All other profile types are downloaded in the same format as uploaded.
Hourly supply and demand profiles resulting from scenario calculations can be downloaded from the Data export section.