Carbon emissions from imported electricity
In the ETM, various carriers can be imported from outside the area of your interest. For electricity, (collective) heat and hydrogen, there are no domestic on-the-spot CO2 emissions: these carriers are produced elsewhere and hence CO2 emissions resulting from this production also take place outside your area. One of the main principles of the ETM CO2 calculation is that emissions are assigned to the location where energy is used, rather than produced. This means that, by default, the ETM does take into account emissions of imported carriers.
The default emission factors for imported electricity, heat and hydrogen can be found in the emission factor article. In the ETM you can change these emission factors in the Flexibility > Import/Export section per interconnector. The sections below provide more background on the emissions of imported electricity using country specific values and carrier-technology specific values.
Imported electricity
The default setting for imported electricity depends on the chosen region and starting year. You can change this default setting for both the present and future year in the ETM in the Flexibility > Import/Export section per interconnector. The tables below give some guidance in choosing an appropriate emission factor in your scenario.
Country specific values
The European Environment Agency offers an overview of all European Union countries and their CO2 emission per kWh. On their website you can select a specific country and you can select the average of all the 28 European Union member states in from 1990 til 2014. Table 1 shows an overview of 2015 data per country.
| Member State | gCO2 emissions / kWh |
|---|---|
| European Union (28 countries) | 314.4 |
| Austria | 97.2 |
| Belgium | 224.3 |
| Bulgaria | 492.8 |
| Croatia | 212.4 |
| Cyprus | 675.4 |
| Czech Republic | 507.5 |
| Denmark | 144.1 |
| Estonia | 850.8 |
| Finland | 108.6 |
| France | 52 |
| Germany | 446.4 |
| Greece | 701.6 |
| Hungary | 276.5 |
| Ireland | 432 |
| Italy | 275.5 |
| Latvia | 127.8 |
| Liechtenstein | None |
| Lithuania | 58.6 |
| Luxembourg | 292.7 |
| Malta | 686.9 |
| Netherlands | 525.1 |
| Poland | 787.3 |
| Portugal | 396.1 |
| Romania | 342.9 |
| Slovakia | 139.3 |
| Slovenia | 256.2 |
| Spain | 318.2 |
| Sweden | 12.1 |
| United Kingdom | 351 |
Source:EEA, 2018)
Carrier-technology specific values
Table 2 shows the CO2 emissions of some carrier-technology combinations.
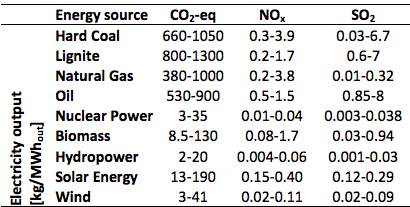
Source:Turkoni et al., 2013). (Note: this is data from a Life Cycle Assessment and has a larger scope than the emissions at the production plant only)