Heat infrastructure costs
Below you can find more information on the heat infrastructure cost calculation in the Costs > 'Heat' sub-section of the ETM. Unless stated otherwise the methodology and data behind this calculation is based on Warmtenetten in Vesta MAIS (Heat networks in Vesta MAIS, CE Delft 2022). Vesta MAIS is an energy model developed by the Dutch Environmental Assessment Agency (PBL). This section provides a summary of the applied method and numbers. A detailed description can be found on ETDataset.
Households and buildings costs
The ETM distinguishes between five types of heat infrastructure costs for households and buildings:
- Indoor costs
- (Secondary) distribution pipelines
- Exchanger stations
- Primary pipelines connecting heat sources to distribution networks
- Storage costs
These costs are annualised by taking into account:
Indoor costs
The indoor costs include all property-related costs.
Households
For households the ETM takes the following indoor costs into account:
- Outdoor construction
- Heat delivery set
- Indoor distribution
- Heat meter
- Indoor construction costs
For indoor construction costs the ETM distinguishes between ground level houses, apartment blocks that currently already have a collective block heating system and apartment blocks that do not. The latter require higher investments as no indoor infrastructure is currently available.
The indoor costs of households are assumed to be independent of the temperature level of the heat network.
| Description | Value |
|---|---|
| Ground level houses | 10,080 euro per connection |
| Apartments with block heating | 4069 euro per connection |
| Apartments without block heating | 7372 euro per connection |
| Share of apartments with block heating | 15% |
Note: The costs and number of apartments with and without block heating can be set per region in the ETM. The numbers above are default values.
Buildings
For non-residential buildings, two types of indoor costs are taken into account:
- Outdoor construction
- Heat delivery set
- Indoor distribution
- Heat meter
The indoor costs consist of a fixed part per connection and a variable part that depends on peak heat capacity. Peak heat capacity is calculated dynamically by the ETM and depends on hourly demand profiles, insulation levels etc.
Checkout: the heat network documentation for more information on the hourly heat calculation.
| Description | Value |
|---|---|
| Indoor costs (fixed part) | 7563 euro per connection |
| Indoor costs (variable part) | 152 euro per kW peak demand |
Note: Indoor costs can be set per region in the ETM. The numbers above are default values.
(Secondary) distribution pipelines
Distribution pipelines deliver heat to residences and buildings throughout a neighbourhood. Two types of pipelines are distinguished:
- Main distribution pipelines
- Connection pipelines: pipelines from street level to front door, connecting a residence
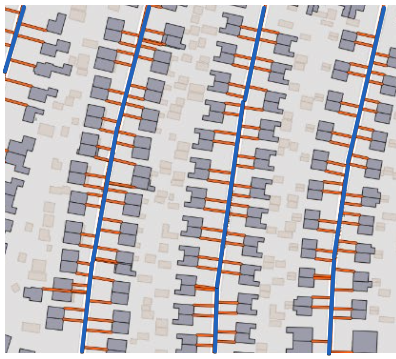
Note: The above image shows main distribution pipelines in blue, and connection pipelines in orange.
Distribution pipelines are shared by both residences and non-residential buildings. Connection pipelines costs are only taken into account for residences. For other buildings it is assumed that heat distribution sub stations are placed directly in or near the building, eliminating the need for connection pipelines. See Exchanger stations below for more info.
| Description | Value |
|---|---|
| Pipelines per meter LT | 2046 euro per meter |
| Pipelines per meter MT | 1818 euro per meter |
| Pipelines per meter HT | 1416 euro per meter |
Note: Pipeline costs can be set per region in the ETM. The numbers above are default values.
The required length of pipelines (for both distribution and connection pipelines) varies per region. Rural areas typically require longer distribution pipeline networks than urban areas to connect the same amount of residences. In addition, average pipeline length per connection can vary within the same region as well: densely populated areas typically require less pipeline length per connected building than less densely populated areas.
To account for this, the ETM distinguishes between five 'length' brackets: A different average pipeline length per connection (and hence different pipeline costs per connection) is assumed depending on how many residences and buildings are connected to the network. I.e.:
- Bracket 1 specifies the average required pipeline length per residence/building if up to 20% of residences/buildings are connected to a district heating network. For each residence/building connected up to 20% of the total housing/building stock, the same average required pipeline length is assumed.
- Bracket 2 specifies the average if up to 40% of residences/buildings are connected.
- Etc.
Depending on the (weighted) average share of residences and buildings connected to district heating networks, the ETM uses a different average length per connected residence/building to determine the required pipeline length of the distribution and connection pipelines. The sum of all heat network connections (LT, MT and HT) is used to determine the total share of connections to district heating networks.
These pipeline length brackets can be specified per region in the ETM. In this way it is possible to distinguish between a city, with lower average pipeline networks per connection, and a rural region, with higher average pipeline lengths. For regions with both urban and rural parts (e.g. a country), the ETM can simulate that pipeline lengths (and thus costs) rise when the share of buildings connected to district heating networks increases: the 'low hanging fruit' (urban areas) is picked first, the more expensive, less densely populated areas follow later.
For all Dutch regions in the ETM, the average pipeline length per connection (both for distribution pipelines and connection pipelines) has been calculated based on an analysis by Greenvis that is used by Vesta MAIS. For each neighbourhood in the Netherlands the required district heating pipeline length has been estimated based on OpenStreetMap data. This data is aggragated per region in the ETM and calculated 5 length brackets per region: the neighbourhoods with the lowest length per connection are in bracket 1 etc.
The Dutch average can be found below. For non-Dutch regions this average is used, unless local data is available.
| Brackets | Average distribution pipeline length |
|---|---|
| Bracket 1 (up to 20% of housing/building stock connected) | 3.2 meter per house/building |
| Bracket 2 (up to 40% of housing/building stock connected) | 4.6 meter per house/building |
| Bracket 3 (up to 60% of housing/building stock connected) | 5.8 meter per house/building |
| Bracket 4 (up to 80% of housing/building stock connected) | 7.0 meter per house/building |
| Bracket 5 (up to 100% of housing/building stock connected) | 10.0 meter per house/building |
Note: For residences the ETM also takes into account additional connection pipelines on top of the lengths specified above.
Example: Suppose 69.1% of residences are connected to a district heating network. The ETM uses the average pipeline length specified by the 'fourth' bracket (7 meters per house/building, up to 80% connected) to determine pipeline costs.
Exchanger stations
The ETM distinguishes between heat exchanger stations and sub stations:
- Exchanger stations are the starting points of the secondary distribution network and are typically located close to the primary heat sources. They include dispatchable/back-up heaters that can be switched on when the primary heat supply is insufficient.
- Heat sub stations are distribution points within the network and may be equipped with pumping systems and heat exchangers.
The required station capacity (and associated costs) are calculated based on the combined demand peak of households and buildings connected to the heat network. The following defaults are used:
| Description | Value |
|---|---|
| Exchanger station (all T-levels) | 133 euro per kW |
| Sub station LT | 100 euro per kW |
| Sub station MT | 50 euro per kW |
| Sub station HT | 50 euro per kW |
| Combined household and building peak demand | Varies |
Note: Station costs can be set per region in the ETM. The numbers above are default values.
The costs of the primary heat sources and dispatchable/back-up heat sources are not part of the heat exchanger costs. These costs are calculated separately, in a similar fashion as (e.g.) power plants.
Primary pipelines
For large-scale heat sources, additional primary pipeline costs are taken into account as these sources are typically not located close to the area of demand. Large-scale heat sources include:
- Residual heat from industry and power plants
- Waste incinerators
- Heat from outside the modelled region ('heat import')
The following costs are taken into account:
| Description | Value |
|---|---|
| Primary pipelines LT | 245 euro per kW |
| Primary pipelines MT | 245 euro per kW |
| Primary pipelines HT | 216 euro per kW |
| Supply peak of large-scale sources | Calculated dynamically |
Note: Primary pipeline costs can be set per region in the ETM. The numbers above are default values.
Storage costs
The ETM does not make a distinction between investment and O&M costs for storage, but instead "charges" a fixed cost per MWh of heat drawn from storage. How much heat is drawn from storage is calculated dynamically per scenario and depends, among other things, on the available heat sources and on the shape of the demand curves. Storage costs are assumed to be the same for all temperature levels.
| Description | Value | Source | |---|---| | Heat storage | 20 euro per MWh | Research Quintel. See ETDataset. | | Heat drawn from storage | Calculated dynamically | |
Note: these costs are costs for storing heat only, cost for producing the stored heat are calculated separately.
Operation and maintenance costs
The following operation and maintenance costs are taken into account:
| Description | Value |
|---|---|
| Indoor infrastructure O&M | 2.5% of total investment costs per year |
| Outdoor infrastructure costs | 1.8% of total investment costs per year |
Note: O&M costs can be set per region in the ETM. The numbers above are default values.
Annualised costs
The total yearly infrastructure costs per year are the sum of:
- Depreciation costs of indoor costs and outdoor investments ((Secondary) distribution pipelines, Exchanger stations and Primary pipelines)
- Capital costs of indoor and outdoor investments
- O&M costs of indoor and outdoor infrastructure
- Storage costs
Yearly capital costs depend on the assumed weighted average cost of capital rate (WACC). By default, a real WACC of 4% is assumed and depreciation is assumed to be linear ('straight line'). This means that the cost of capital per year equal (total investment costs / 2) * WACC.
Checkout: the 'Cost of Capital' infopage for more information.
Agriculture and industry
The ETM currently does not take into account heat infrastructure costs for collective heat used in the agriculture and industry sectors. The reason for this is that there is insufficient information available to make a reasonable estimate of these costs. There is a large variation in infrastructure costs in these sectors depending on factors that are currently insufficiently modelled in the ETM, such as whether companies are clustered or not; what heat temperatures are used etc.